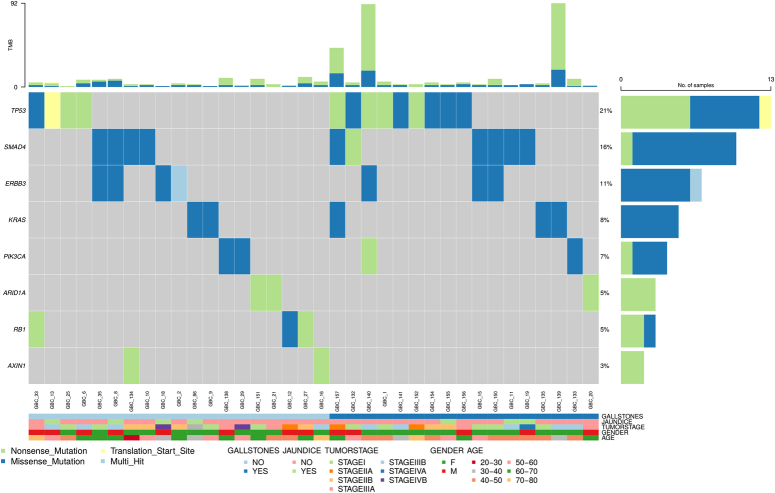
Figure 4.
Oncoplot depicting the distribution of eight prevalent genes—TP53, SMAD4, ERBB3, KRAS, PIK3CA, ARID1A, RB1, and AXIN1—within the GBC cohort. These genes, mutated in at least two GBC samples, are noted for their oncogenic mutations which have implications for therapy, diagnosis, and prognosis. Gene variants are correlated with sample, age, sex, tumor stage, and status of gallstones and jaundice. Each column represents a distinct GBC sample, and each row corresponds to a specific gene. Colored squares indicate altered genes, while grey squares denote non-mutated genes.

