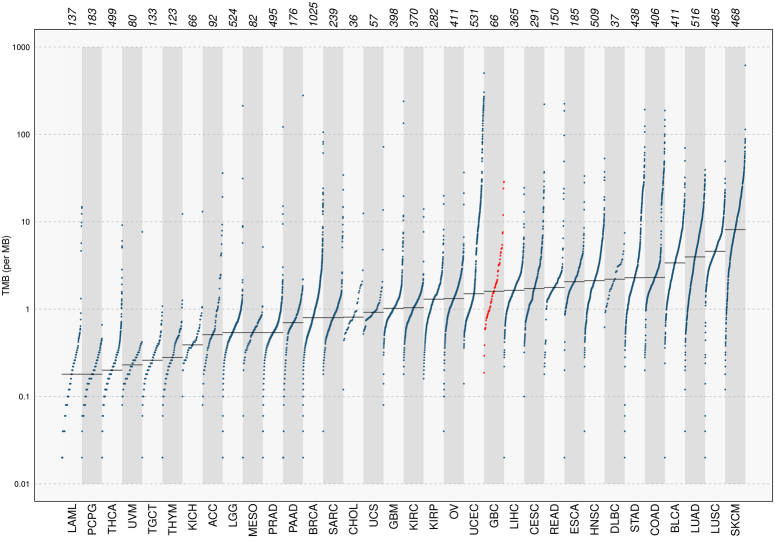
Figure 6.
Prevalence of Somatic mutation burden in our population(GBC, n=66- highlighted in red color) compared to 33 TCGA cohorts. Each dot represents a single patient sample. The horizontal grey lines indicate the median number of mutations in each cancer category. Vertical axes (log scaled) showed the number of mutations per megabase.

