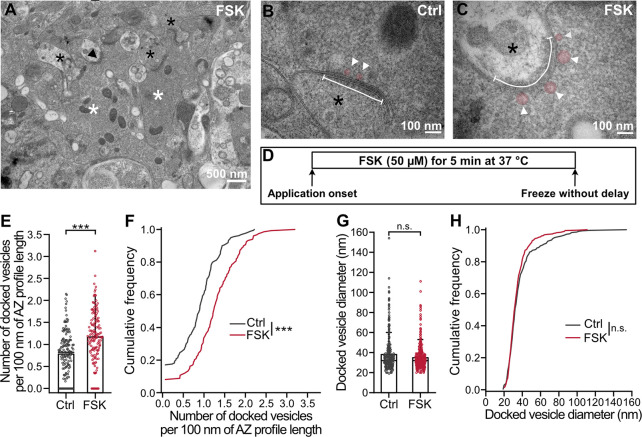
Fig 3. Docked vesicle pool of MFBs expands after induction of chemical potentiation.
(A) Example TEM micrograph from acute hippocampal slices, showing putative MFBs (white asterisks) with apparent postsynaptic spines (black asterisks) in stratum lucidum of CA3 region. MFBs were recognized based on characteristic morphological features: large bouton size, high density of clear SVs, presence of large dense-core vesicles, high-density of mitochondria, and multiple synaptic contacts with large spines. Black arrowhead points to an AZ shown in (C). (B, C) Higher magnification TEM micrographs showing AZs (white line) and docked SVs (pink circles and white arrowheads) in putative MFBs in DMSO control (B, “Ctrl”) and after 50 μM forskolin (C, “FSK”). (D) Schematic representation of the time course of the experiment with 5-min forskolin (“FSK”) treatment. (E) Summary bar graph of the number of docked vesicles per 100 nm of AZ profile length in DMSO control (“Ctrl,” gray) and after forskolin application (“FSK,” red). Note zero values indicate AZs without any observed docked vesicles. Bars and whiskers show mean + SD. Horizontal black lines indicate median values. P < 0.0001, Mann–Whitney test. (F) Cumulative plots of the data displayed in (E), color scheme is identical to (E). P < 0.0001, Mann–Whitney test. (G) Summary bar graph of the diameter of docked vesicles measured in DMSO control (“Ctrl,” gray) and after forskolin treatment (“FSK,” red). Bars and whiskers show mean + SD. Horizontal black lines indicate median values. P = 0.1689, Mann–Whitney test. (H) Cumulative plots of the data displayed in (G), color scheme is identical to (G). P = 0.2317, Mann–Whitney test. Scale bar sizes are indicated on the figure panels. Numerical values for this figure are detailed at https://doi.org/10.15479/AT:ISTA:18296. AZ, active zone; DMSO, dimethyl sulfoxide; MFB, mossy fiber bouton; SD, standard deviation; SV, synaptic vesicle; TEM, transmission electron microscopy.

