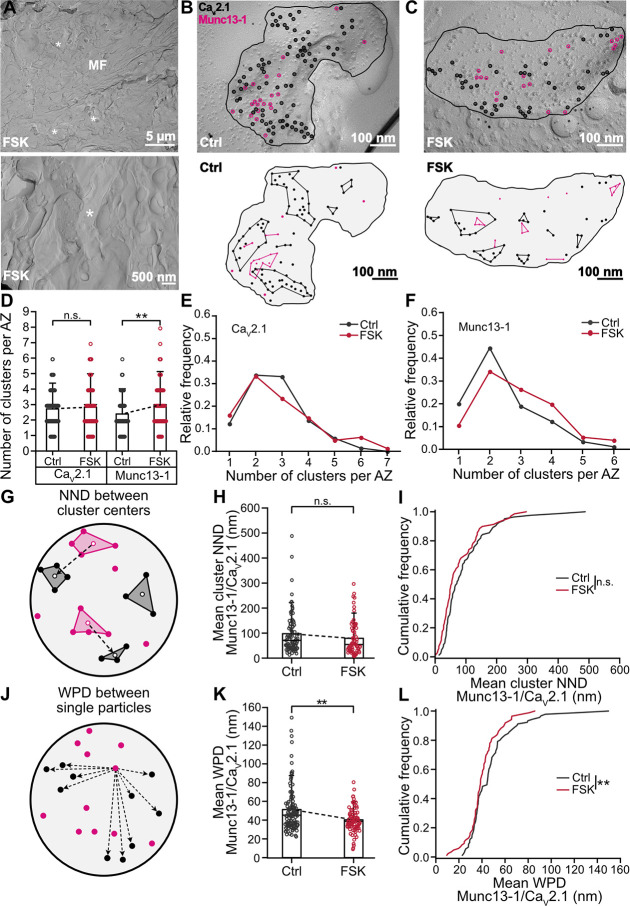
Fig 4. Rearrangement of CaV2.1 and Munc13-1 proteins within MFB AZs after induction of chemical potentiation.
(A) Top panel: example TEM micrograph of freeze-fractured replicas of acute slices showing ultrastructural quality of stratum lucidum of the CA3 region, with MF axon and putative MFBs (white asterisks) after 50 μM forskolin (“FSK”). Bottom panel: higher magnification TEM micrograph showing putative MFB (white asterisk) in stratum lucidum of CA3 region after forskolin (“FSK”). MFBs were recognized based on characteristic morphological features: large bouton size and presence of adjacent cross-fracture with high density of SVs. (B, C) Top panel: higher magnification micrographs with putative MFB AZs (black line) co-labeled against CaV2.1 (black empty circles) and Munc13-1 (pink empty circles) in DMSO control (B, “Ctrl”) and after forskolin treatment (C, “FSK”). Bottom panel: schematic of the above AZs with CaV2.1 and Munc13-1 clusters (black and pink circles connected with lines, respectively) in DMSO control (B, “Ctrl”) and after forskolin treatment (C, “FSK”). Note that some CaV2.1 and Munc13-1 particles do not belong to any cluster and are considered “noise” points (single black and pink circles, respectively). (D) Summary bar graph of the number of CaV2.1 and Munc13-1 clusters per AZ in DMSO control (“Ctrl,” gray) and after forskolin (“FSK,” red). Bars and whiskers show mean + SD. Horizontal black lines indicate median values. CaV2.1: P = 0.1595; Munc13-1: P = 0.0088, both Mann–Whitney tests. (E, F) Relative frequency distribution of data displayed in (D), CaV2.1 (E), Munc13-1 (F), color scheme is identical to (D). (G) Scheme of distances between Munc13-1 and CaV2.1 clusters (pink and black polygons, respectively). NND between clusters was quantified as Euclidian distance (dashed line) between centers of Munc13-1 clusters (empty pink circles) to the closest center of CaV2.1 cluster (empty black circles). The results are shown in (H and I). (H) Summary bar graph of the mean NND between Munc13-1 and CaV2.1 clusters in DMSO control (“Ctrl,” gray) and after forskolin (“FSK,” red). Bars and whiskers show mean + SD. Horizontal black lines indicate median values. P = 0.0653, Mann–Whitney test. (I) Cumulative plots of mean NND between Munc13-1 and CaV2.1 clusters, color scheme is identical to (H). P = 0.0653, Mann–Whitney test. (J) Scheme of WPD quantification between Munc13-1s and CaV2.1 channels. WPD between particles was quantified as Euclidian distance (dashed lines) between each Munc13-1 particle (pink circles) to each CaV2.1 particle (black circles). The results are shown in (K and L). (K) Summary bar graph of the mean WPDs between Munc13-1 and CaV2.1, color scheme is identical to (H). Bars and whiskers show mean + SD. Horizontal black lines indicate median values. P = 0.0034, Mann–Whitney test. (L) Cumulative plots of mean WPDs between experimental Munc13-1 and CaV2.1 point patterns, color scheme is identical to (H). P = 0.0034, Mann–Whitney test. Scale bar sizes are indicated on the figure panels. See S3–S9 Figs. Numerical values for this figure are detailed at https://doi.org/10.15479/AT:ISTA:18296. AZ, active zone; DMSO, dimethyl sulfoxide; MF, mossy fiber; MFB, mossy fiber bouton; NND, nearest neighbor distance; SD, standard deviation; SV, synaptic vesicle; TEM, transmission electron microscopy; WPD, weighted pairwise distance.

