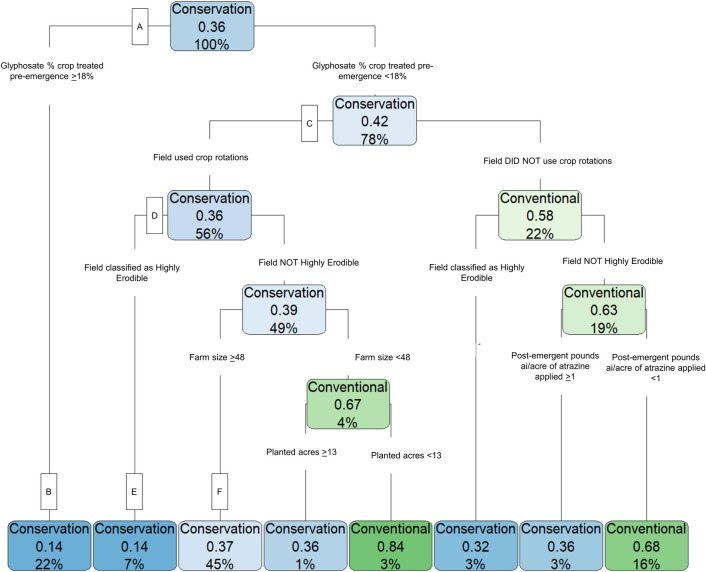
Fig 6. For field corn, pre-emergent glyphosate percent of crop treated was the strongest predictor of conservation tillage.
This chart shows CART analysis results for 2016 field corn responses (n = 1,995). Blue shading indicates that the model predicts conservation tillage use for the subgroup, with a darker color indicating a higher predicted probability. The word “conservation” or “conventional” in each blue or green box shows the tillage type predicted for that subgroup of producers. The middle number, expressed as a decimal, represents the probability of conventional tillage adoption. For blue-shaded boxes where conservation tillage is predicted, the probability of conservation tillage is calculated as 1 minus the value in the box (e.g., at node B, the predicted probability of conservation tillage is 1–0.14 = 0.86). The last number, expressed as a percentage represents the share of the training sample that is categorized into that subgroup (e.g., at node B, 22% of respondents are in this subgroup).

