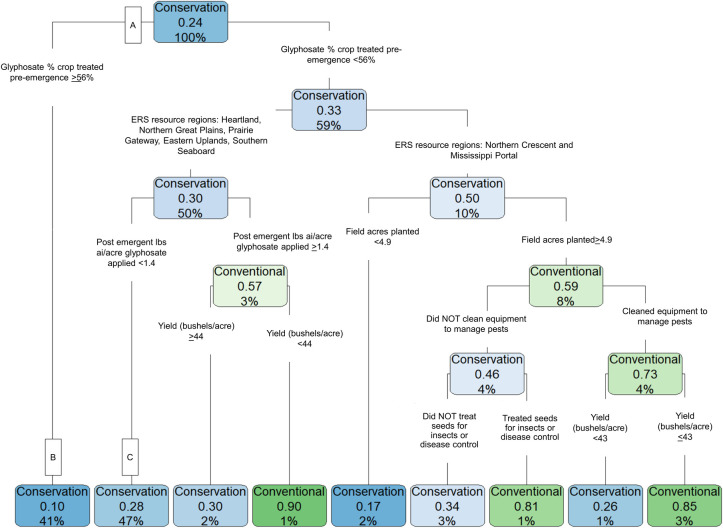
Fig 7. For soybeans, pre-emergent glyphosate percent of crop treated was also the strongest predictor of conservation tillage.
This chart shows CART analysis results for 2018 soybean responses (n = 2,260). Blue shading indicates that the model predicts conservation tillage use for the subgroup, with a darker color indicating a higher predicted probability. The word “conservation” or “conventional” in each blue or green box indicates which tillage type the model predicts for that subgroup of producers. The middle number that is expressed as a decimal indicates the probability of conventional tillage adoption. For boxes shaded in blue, where conservation tillage is predicted, the predicted probability of conservation tillage is calculated as 1 minus the value in the box (e.g., at node B, the predicted probability of conservation tillage is 1–0.1 = 0.90). The last number in the boxes, expressed as percentages, indicate the share of the training sample categorized into that subgroup (e.g., at node B, the model categorizes 41% of respondents into this subgroup).

