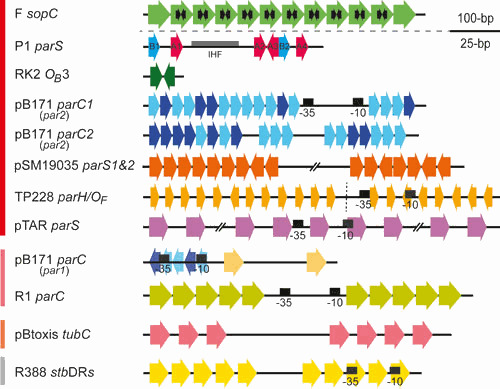
Figure 3.

The organization and composition of centromeres are highly diverse. Direct and inverted repeats are depicted by oriented arrows with the same color, indicating conserved motifs. For parSF, the black inverted arrows represent the 16-bp inverted repeat ParB binding sites within the 43-bp direct repeats (green arrows). The centromere of P1 is composed of two 6-bp box B (blue) and four 7-bp box A (red) motifs present on both sides of an integration host factor (IHF) binding site (gray rectangle). The RK2 centromere (OB3) consists of one inverted repeat of 13 bp. For pB171, the parC1 and parC2 regions of par2 are composed of 17 (2 clusters) and 18 (3 clusters) repeats, respectively, of a 6-bp motif. The parS site of par1 comprises only two identical 10-bp motifs (orange arrows) in direct orientation separated by a 31-bp direct repeat; the blue arrows overlapping the −35 and −10 promoter sequences correspond to the beginning of parC1 from the par2 locus involved in the cross-regulation between the two Par systems of pB171. pSM19035 carries three parS loci composed of contiguous repeats of 7 bp in direct or inverse orientations (only parS1 and parS2 are depicted). For parSTP228, the two centromere regions, parH (left) and OF (right), delineated by a vertical dashed line, are composed of 12 and 8 degenerated repeats (4 bp) separated by AT-rich spacers (4 bp), respectively. The pTAR centromere contains 13 repeats of 9 bp, each separated by 8 bp, encompassing the −35 and −10 promoter boxes. The centromere of plasmid R1 comprises two arrays, spaced by 39 bp, composed of five direct repeats of 11 bp. The pBtoxis centromere, tubC, comprises two arrays of three and four 12-bp motifs, separated by 54 bp. For parSR388, the two arrays spaced by 43 bp are each composed of five direct repeats of 9 bp separated by 2 bp; the putative −35 and −10 promoter sequences are deduced from the sequence. Note that (i) the scale for the large sopC centromeres is different from all others (separated by the horizontal gray dashed line), and (ii) only 9 out of 13 repeats of the pTAR parS are drawn. The parS centromeres are depicted in the same order with the same color code (colored vertical lines on the left) as the partition loci to which they belong (Fig. 1).
