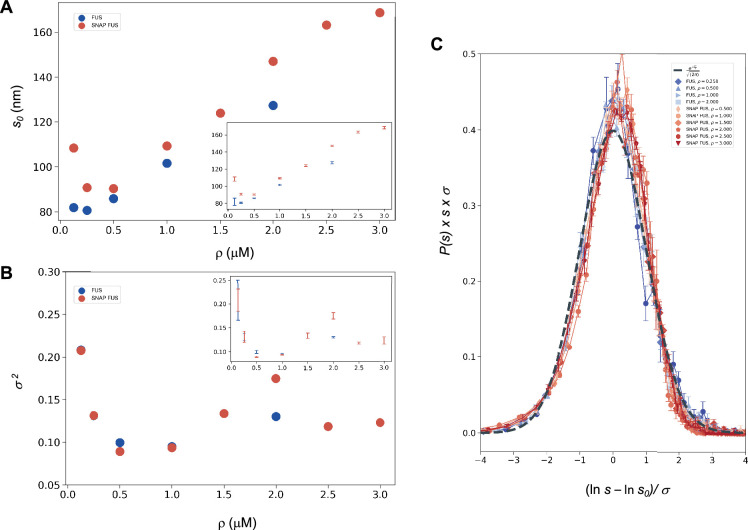
Figure 2. Log-normal behaviour of FUS and SNAP-tagged FUS size distributions below the critical concentration.
Variation of the size distribution with protein concentration: ln s0 (A) and σ (B). lns0 and σ (inset) were computed for FUS (blue) and SNAP-tagged FUS (red) using Equation 11. Error bars (in inset for graphical clarity) are estimated from three independent measurements. While droplet sizes increase with concentration, the width of distribution does not change considerably. (C) The collapse of the droplet size distribution functions is consistent with a log-normal behaviour. The droplet size distribution functions for both untagged FUS (blue) and SNAP-tagged FUS (red) are plotted after rescaling the sizes by the ln s0 and σ values, the first and second moments of the logarithm of the droplet size distribution, which are a function of the concentration. The rescaled curves for both the untagged and the tagged protein collapse to the normal distribution (grey dashed), as expected when the non-rescaled droplet sizes follow a log-normal distribution.

