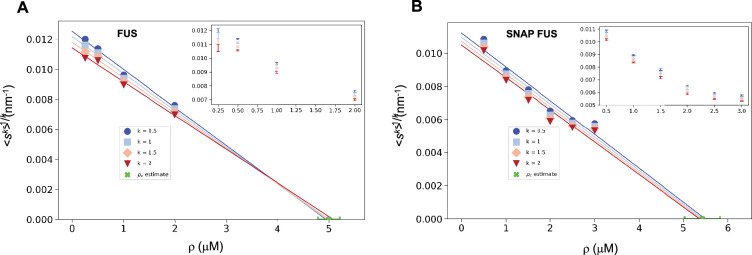
Figure 3. Estimation of the critical concentration of FUS using the scale invariance.
Critical concentration of FUS (5.0 ± 0.2 μM) (A) and SNAP-tagged FUS (5.4 ± 0.4 μM) (B). The scaling model predicts that the function of the moments plotted versus the concentration ρ becomes a straight line near the critical concentration ρc and intersects the ρ-axis at ρc, independently of the value of k. Error-weighted linear regressions are performed in both cases excluding the data point at the lowest concentration ρ = 0.125 μM. The resulting estimate of the critical concentration is shown in green along with the corresponding standard deviation, estimated from three independent measurements.

