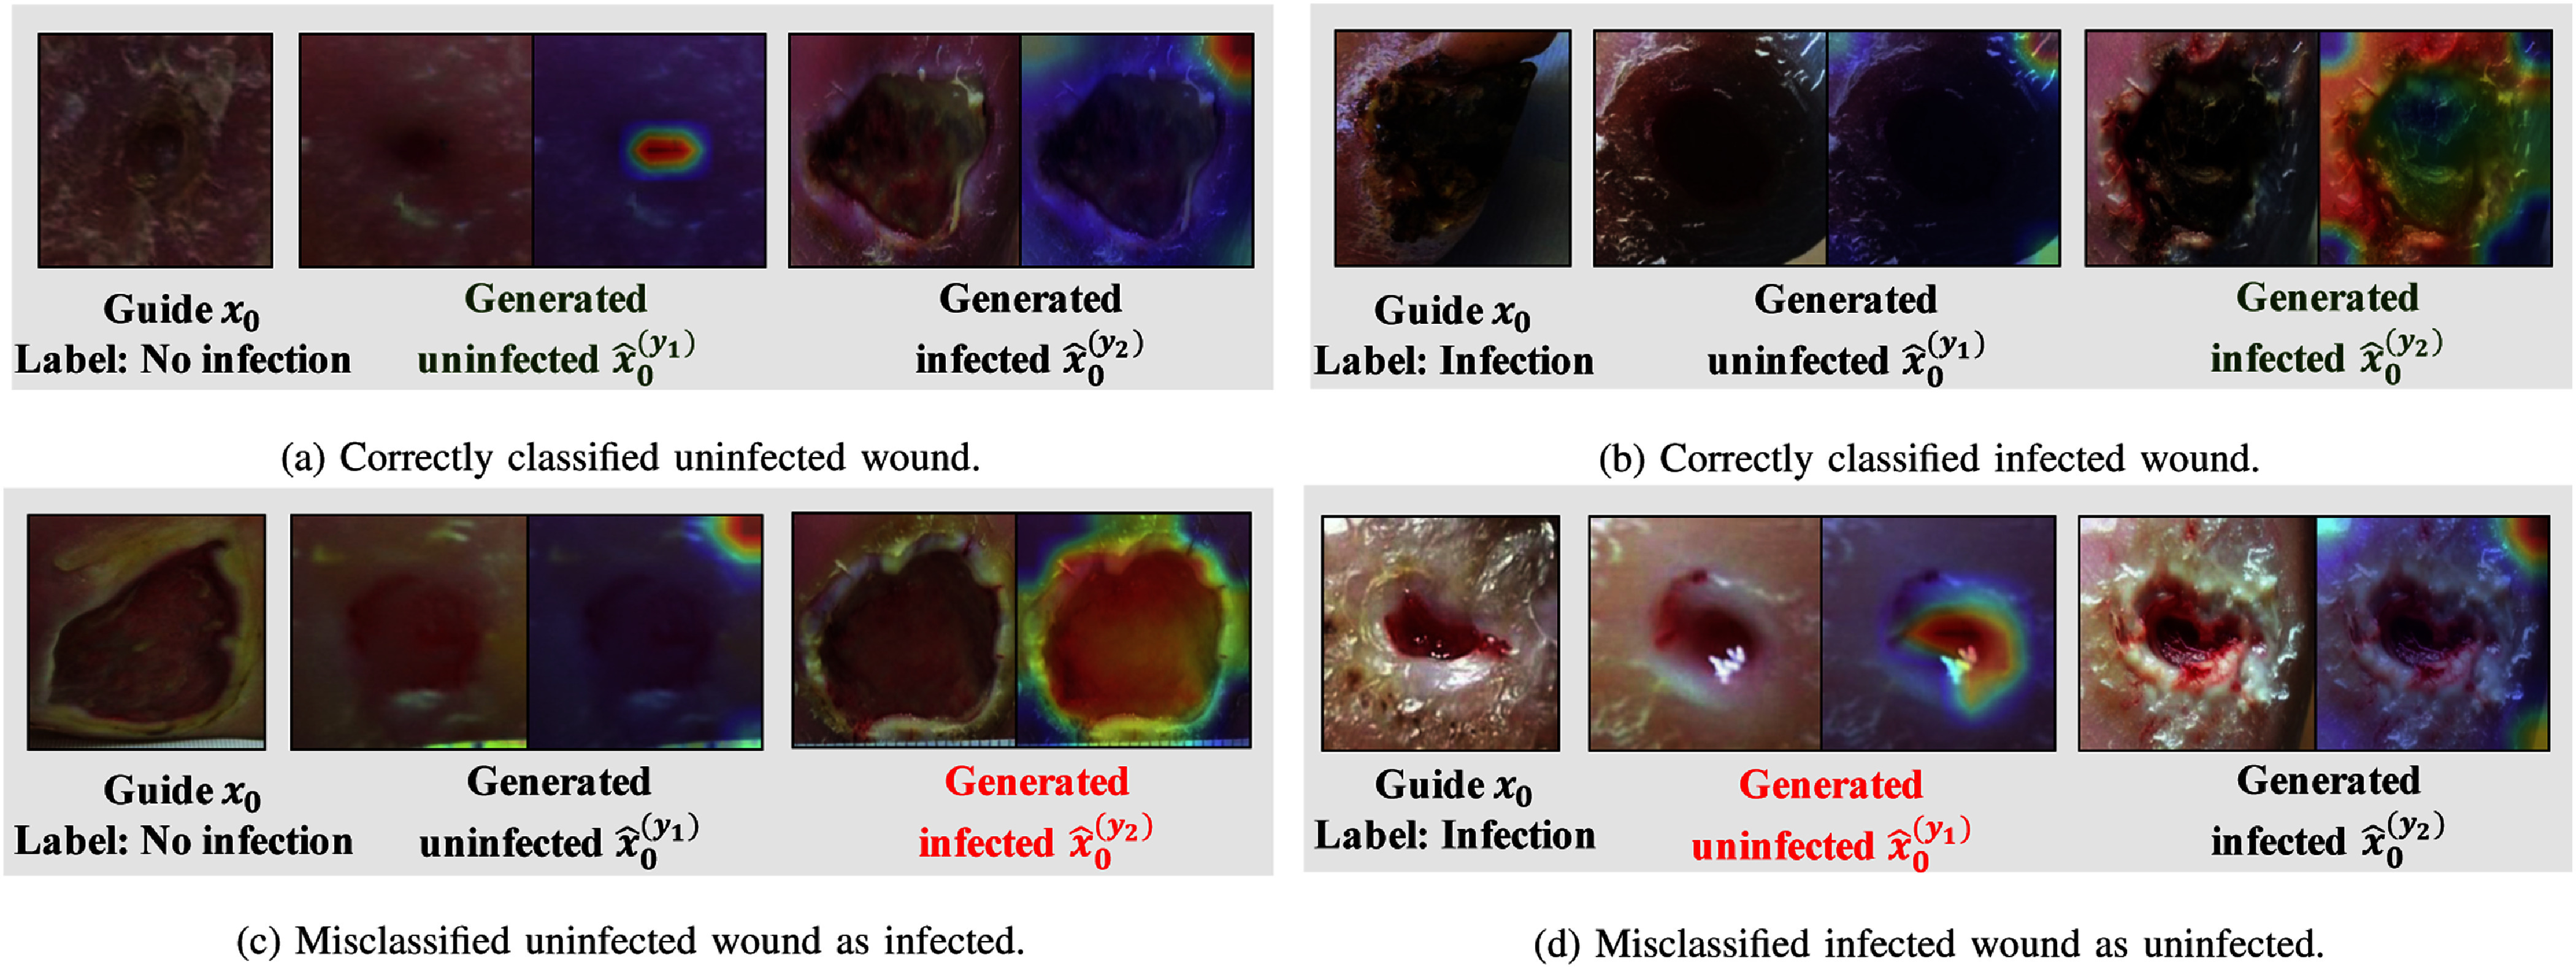
Fig. 6.

Visualization of ConDiff predictions with corresponding Score-CAM images computed from the ConDiff's embedding model  . Each sub-figure shows an example with the guide image (
 ), conditional synthesized images representing uninfected
  and infected
  states, and their respective Score-CAM overlays indicate regions with similar features to
  .
.
