
FIGURE 4.
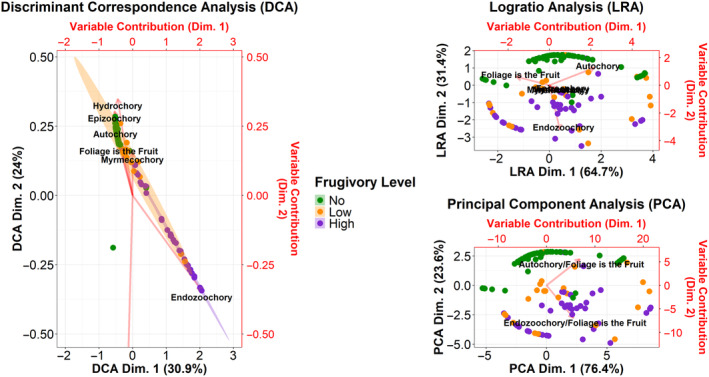
Correspondence analysis (CA) illustrating the influence of frugivory on the plant syndromes dispersed by the gopher tortoise. The 99% confidence intervals are drawn around the “No” (green), “Low” (orange), and “High” (purple) frugivory levels. The red arrows depict the eigenvectors for each dispersal syndrome, indicating how they change in relation to frugivory. The dispersal syndromes are labeled in the following fashion, “endo” = Endozoochory, “myrme” = Myrmecochory, “foliage” = Foliage is the Fruit, “anemo” = Anemochory, “epizoo” = Epizoochory, “auto” = Autochory, “hydro” = Hydrochory.