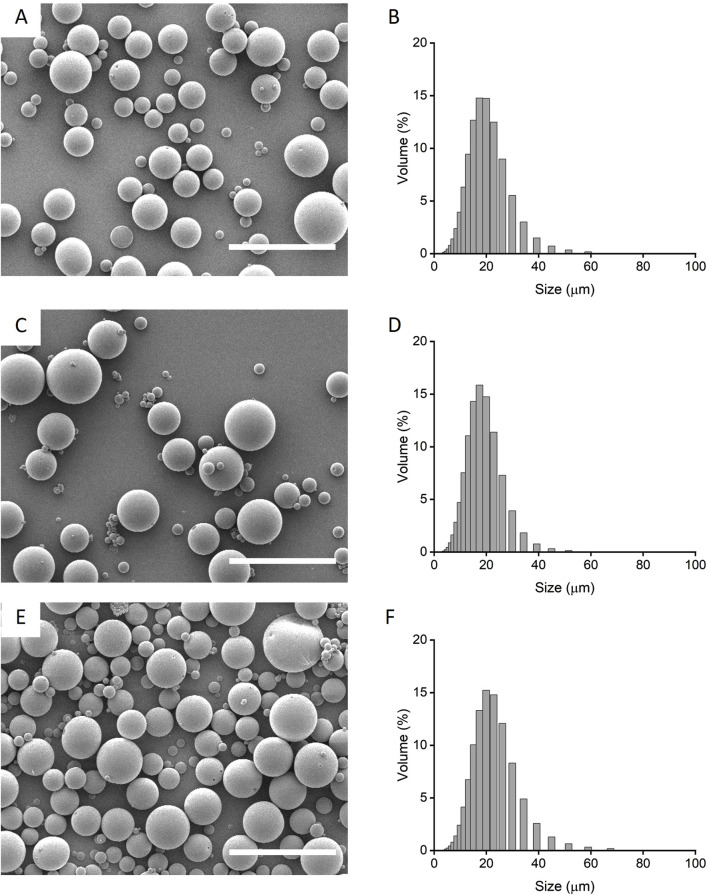
FIGURE 1.
Qualitative scanning electron micrographs (A, C, E) and quantitative laser diffraction size distribution (B, D, F) of microparticles fabricated with PLGA85:15 incorporated with 40% TB (A, B) with absence of protein, i.e., blank; (C, D) encapsulated with HSA alone and, (E, F) encapsulated with IL-4/HSA. Scale bars represent 50 µm.

