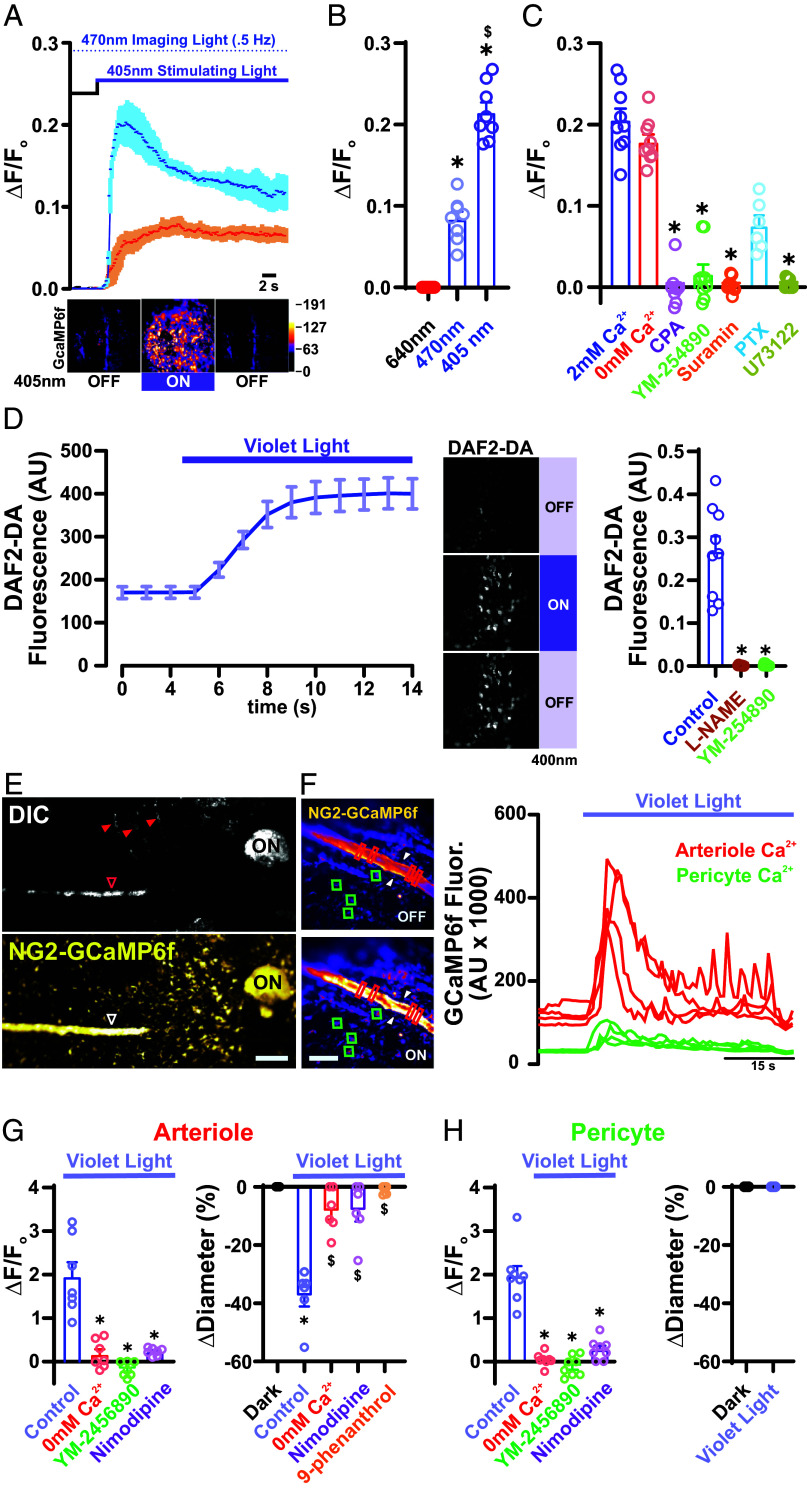
Fig. 1.
Violet light stimulate cell-specific Ca2+ signals in the choriocapillaris. (A) Top: Representative trace of averaged GcAMP6f fluorescence in the choriocapillaris endothelium in response to constant violet light stimulation (405 nm) at 2.04 × 10¹⁴ photons/cm2/s (orange) and 6.1 × 10¹⁴ photons/cm2/s (blue) (n = 3 choroid preparations from 3 mice per group). (A) Bottom: Representative micrographs of a choroidal preparation from a Cdh5-GCaMP6f mouse showing Ca2+ levels before (Left), 5 s after (Middle), and 10 s after (Right) light stimulation. (B) Summary data showing changes in GcaMP6f fluorescence (∆F/Fo) in the choriocapillaris endothelium in response to light stimulation (6.1 × 10¹⁴ photons/cm2/s) at 405, 470, and 640 nm. Data are presented as means ± SEM [error bars; *P < 0.05; n = 5 regions of interest (ROIs) in 5 choroids from 3 mice per group]. (C) Summary data showing changes in fluorescence in the choriocapillaris endothelium in response to light stimulation (405 nm, 6.1 × 10¹⁴ photons/cm2/s) under control conditions (2 mM Ca2+) and with 0 mM Ca2+ in the absence or presence of CPA (5 µmol/L), YM-254890 (1 µmol/L), suramin (5 μM), or U73122 (3 μM). Data are presented as means ± SEM (error bars; *P < 0.05; n = 9 ROIs in 5 choroids from 5 mice per group). (D, Left) Traces showing averaged fluorescence of the NO indicator, DAF2-DA (5 μM), in the choriocapillaris endothelium in response to violet light stimulation (405 nm, 6.1 × 10¹⁴ photons/cm2/s). (D, Middle) Representative micrographs of a choroidal preparation showing DAF2-DA fluorescence before (Top), 5 s after (Middle), and 10 s after (Bottom) light stimulation. (Scale bars, 20 μm.) (D, Right) Summary data showing changes in DAF2-DA fluorescence in the choriocapillaris endothelium in response to violet light stimulation (405 nm, 6.1 × 10¹⁴ photons/cm2/s) under control conditions and in the presence of L-NAME (10 μM) or YM-254890 (1 μM). Data are presented as means ± SEM (error bars; *P < 0.05; n = 9 ROIs in 6 choroids from 3 mice per group). (E, Top) Representative low-magnification contrast light image of the en face whole mount choroid preparation from an NG2-GCaMP6f mouse showing the hypopigmented areas of choroidal fissures where vessels and nerves run (arrowheads). (E, Bottom) Fluorescence micrograph of the same region shown in the DIC image above identifying arterioles (open arrowhead) and pericytes. (Scale bars, 300 µm.) (F, Left) Representative images of a region from an NG2-GcaMP6f mouse showing an arteriole and capillary pericytes, highlighted by red rectangular and green square ROIs, respectively, under light-off conditions (Top) and following stimulation with violet light (405 nm, 6.1 × 10¹⁴ photons/cm2/s) (Bottom). (F, Right) Traces showing Ca2+ levels in ROIs in the arteriole (red rectangles) and pericytes (green squares) in B (Bottom). (Scale bar, 10 µm.) (G, Left) Summary data showing changes in GCaMP6f fluorescence in arterioles in response to violet stimulation (405 nm, 6.1 × 10¹⁴ photons/cm2/s) under control conditions (2 mM Ca2+) and with 0 mM Ca2+ in the absence or presence of YM-254890 (1 μM) or nimodipine (5 μM). Data are presented as means ± SEM (error bars; *P < 0.05; n = 8 ROIs in 6 choroids from 3 mice per group). (G, Right) Summary data showing changes in ciliary arteriolar diameter in response to violet light stimulation (405 nm, 6.1 × 10¹⁴ photons/cm2/s) under control conditions (2 mM Ca2+) and with 0 mM Ca2+ in the absence or presence of YM-254890 (1 µmol/L), nimodipine (5 μM), or 9-phenanthrol (30 μM). Data are presented as means ± SEM (error bars; *P < 0.05; n = 6 vessels in 6 choroids from 3 mice per group). (H, Left) Summary data showing changes in GCaMP6f fluorescence in choriocapillaris pericytes in response to violet light stimulation (405 nm, 6.1 × 10¹⁴ photons/cm2/s) under control conditions (2 mM Ca2+) and with 0 mM Ca2+ in the absence and presence of YM-254890 (1 μM) or nimodipine (5 μM). (H, Right) Summary data showing changes in capillary vessels in response to violet light stimulation (405 nm, 6.1 × 10¹⁴ photons/cm2/s) under control conditions (2 mM Ca2+). Data are presented as means ± SEM (error bars; *P < 0.05; n = 7 ROIs in 6 choroids from 3 mice per group).

