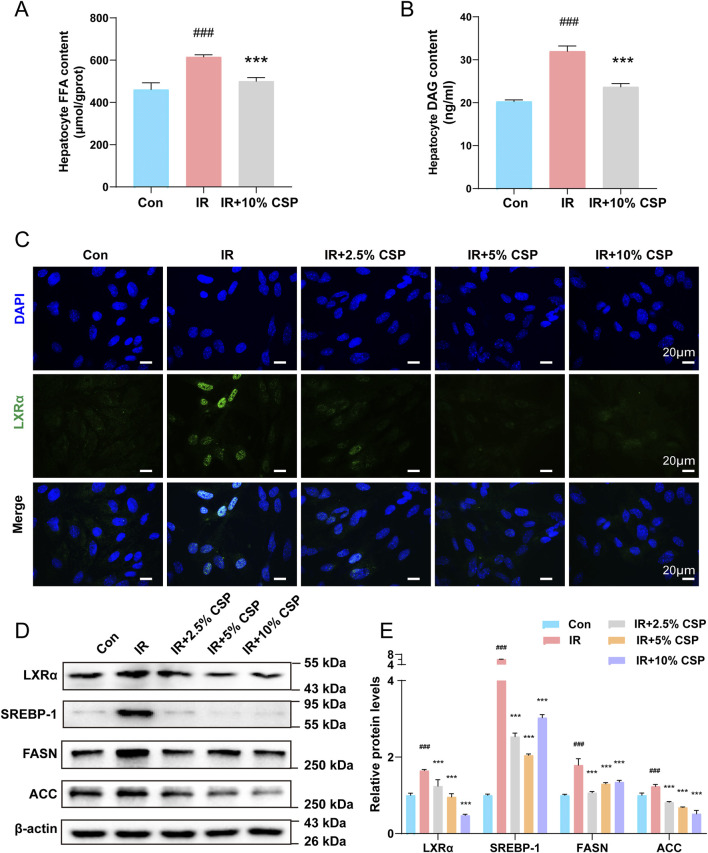
FIGURE 5.
The CSP inhibited de novo lipogenesis in hepatocytes. (A, B) FFA and DAG content in hepatocytes. (C) Representative images of immunofluorescent staining of LXRα in hepatocytes (scale bar: 20 μm). (D, E) The protein expression levels of LXRα, SREBP-1, FASN, and ACC were measured in hepatocytes. Data (E) are presented as mean ± SD. ## p < 0.01, ### p < 0.001, *p < 0.05, **p < 0.01, ***p < 0.001,# versus the CON group, * versus the IR group, n = 3 samples per group.

