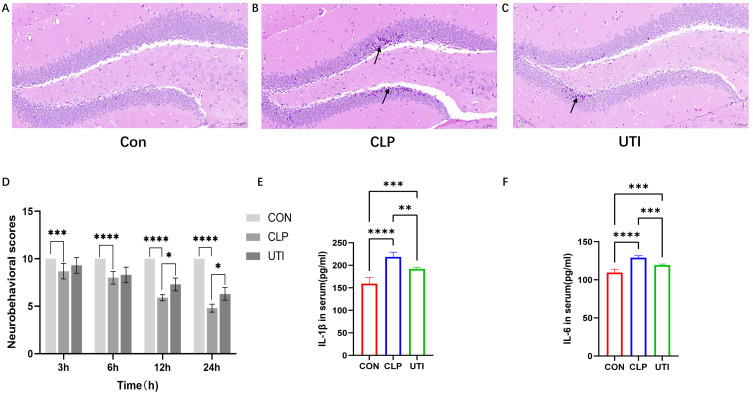
Figure 1.
Effects of UTI on Hippocampal Neurons, Neurobehavioral Performance and Inflammatory Cytokines in Septic Mice. (A–C) Representative images of HE-stained hippocampal sections from each group. Black arrows indicate nuclear disorder, neuronal shrinkage, and necrosis. Magnification:×20. (D) Neurobehavioral score. Data is represented by histograms. Values are expressed as mean ± SEM (n = 10 in each group). (E and F) The comparisons of IL-1β, IL-6 in serum in different groups. * p<0.05, ** p<0.01, *** p<0.001, **** p<0.0001, n=6.

