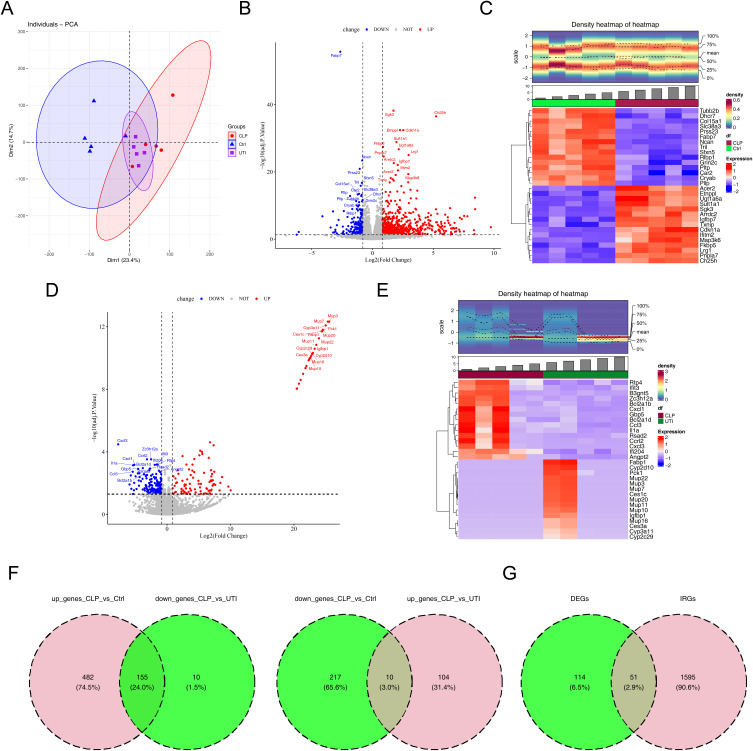
Figure 3.
Identification of immune-related differentially expressed genes (DE-IRGs). (A) Principal Component Analysis. (B) Volcano plot depicting DEGs between CLP and control groups. (C) Heatmap illustrating DEGs between CLP and control groups. (D) Volcano plot of DEGs between CLP and UTI groups. (E) Heatmap of DEGs between CLP and UTI groups. (F) Venn diagram of differentially expressed genes (DEGs) among control, CLP, and UTI groups. (G) Venn diagram showing the overlap between IRGs and DEGs.

