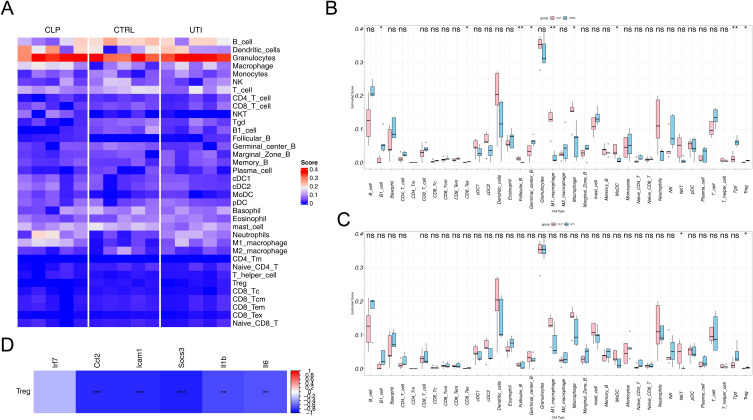
Figure 7.
Immune cell infiltration analysis across the three groups. (A) Heatmap showing the distribution of 36 immune cell types in each sample. (B) Differential analysis of 36 immune cell types between the control and CLP groups. (C) Differential analysis of 36 immune cell types between the CLP and UTI groups. (D) Correlation analysis between the six hub genes and Treg cells. * p<0.05, ** p<0.01, *** p<0.001.

