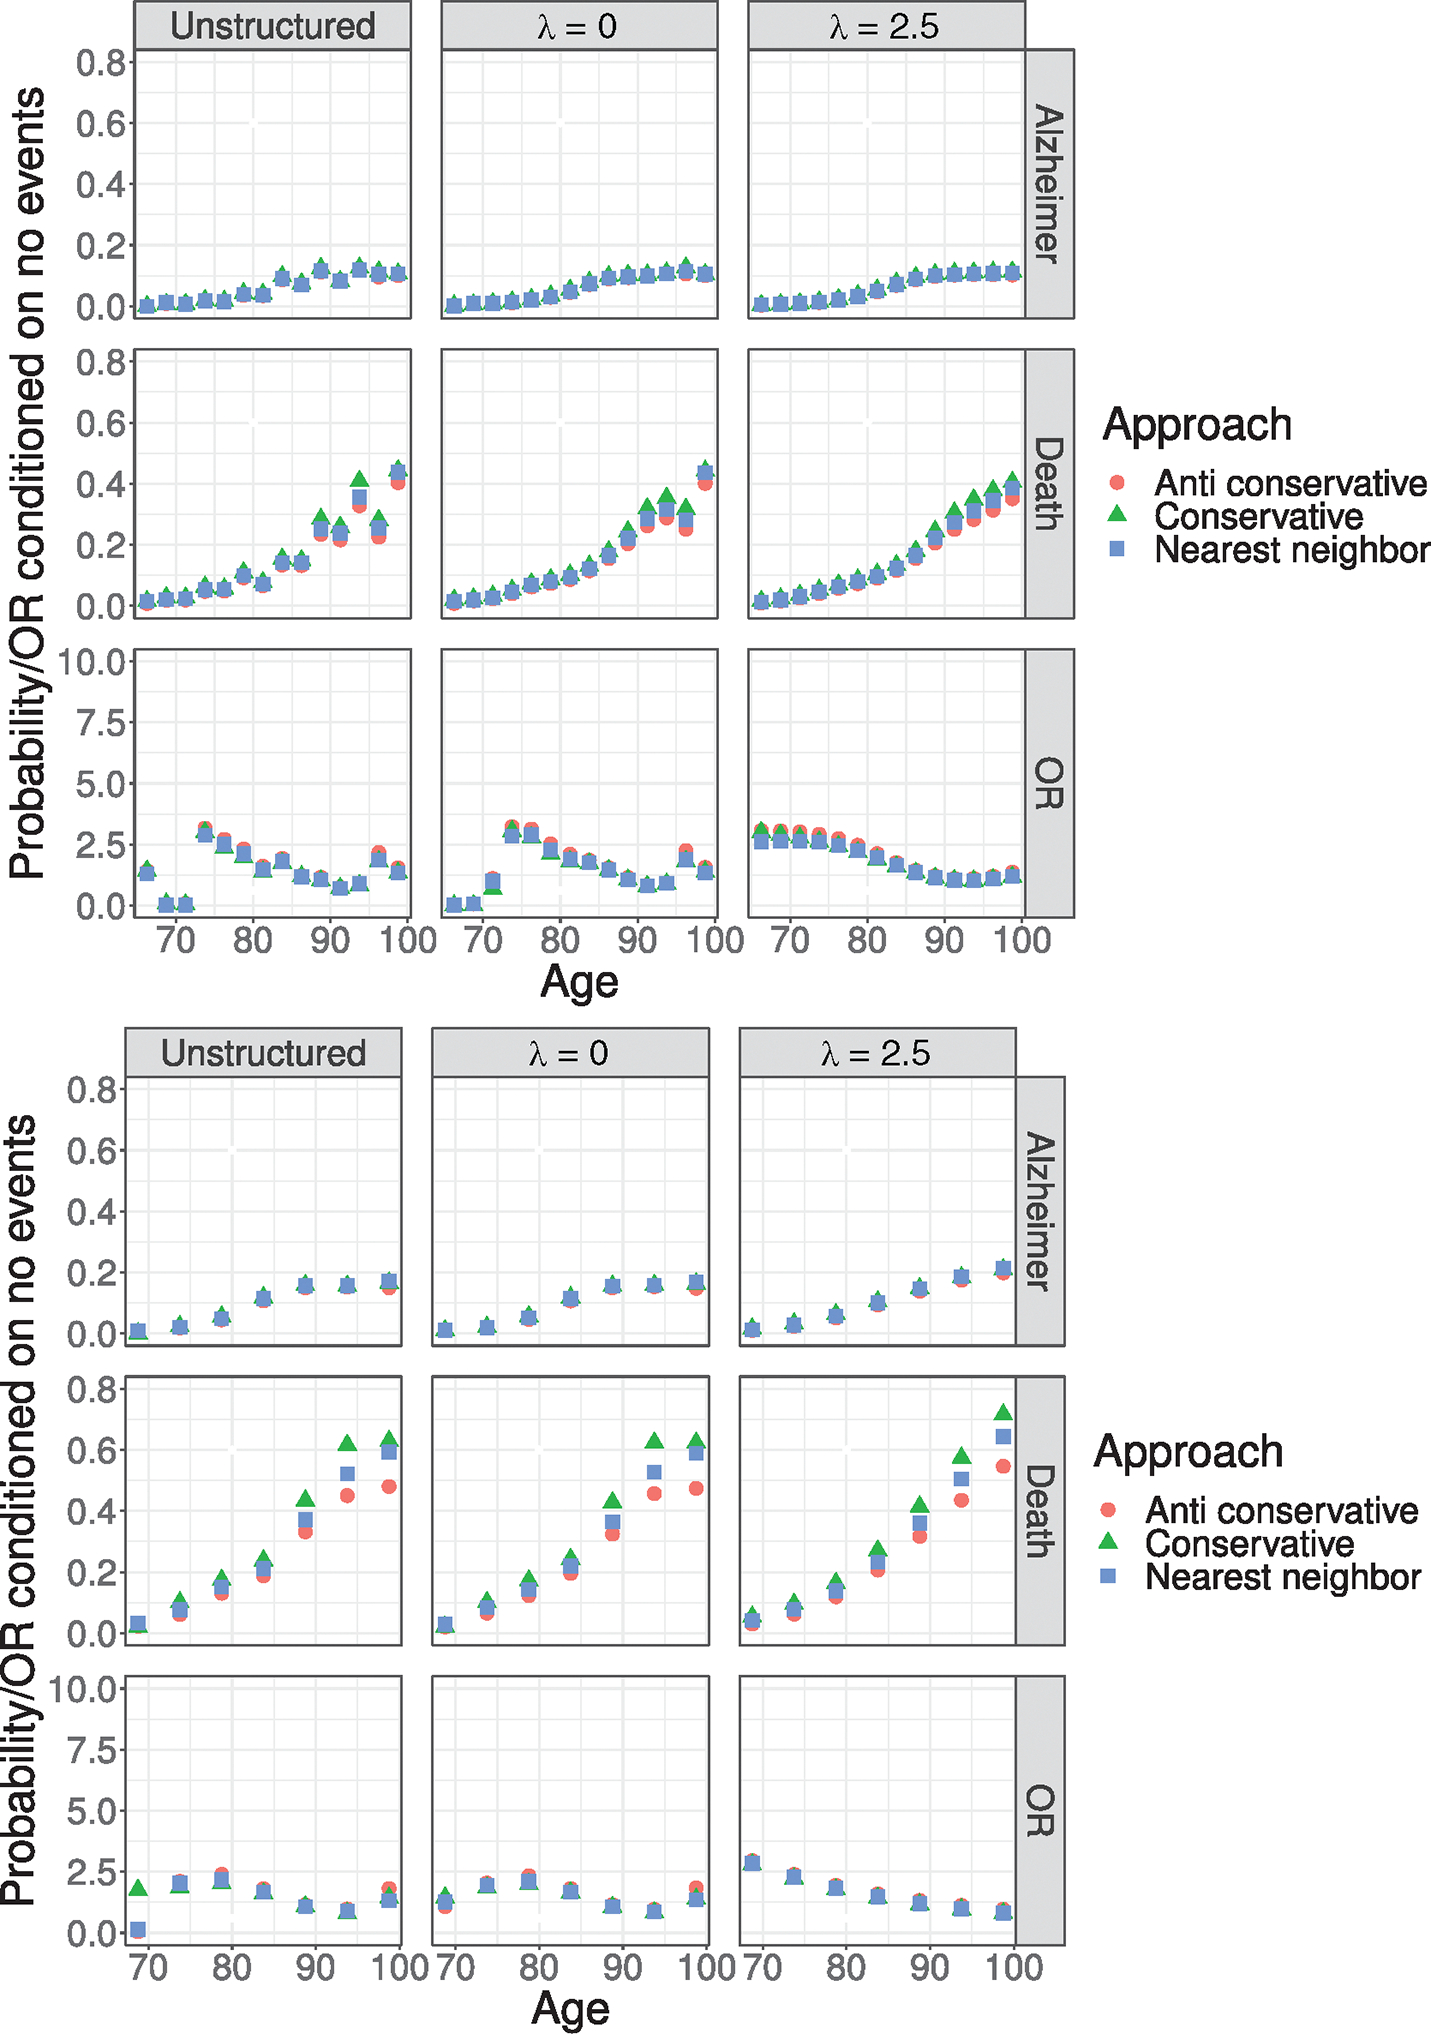
FIGURE 2.

Comparison in the ACT data between the three approaches to overcome within-interval censoring and study entry times. The figures present the estimated baseline time trends, , and , under the unstructured specification and the B-spline specification with and under the two partitions (top panel) and (bottom panel). Note that the -axis has been truncated at 0.8 for and at 10 for .
