Figure 2.
Contiune.
Figure 2.
Contiune.
Figure 2.
Contiune.
Figure 2.
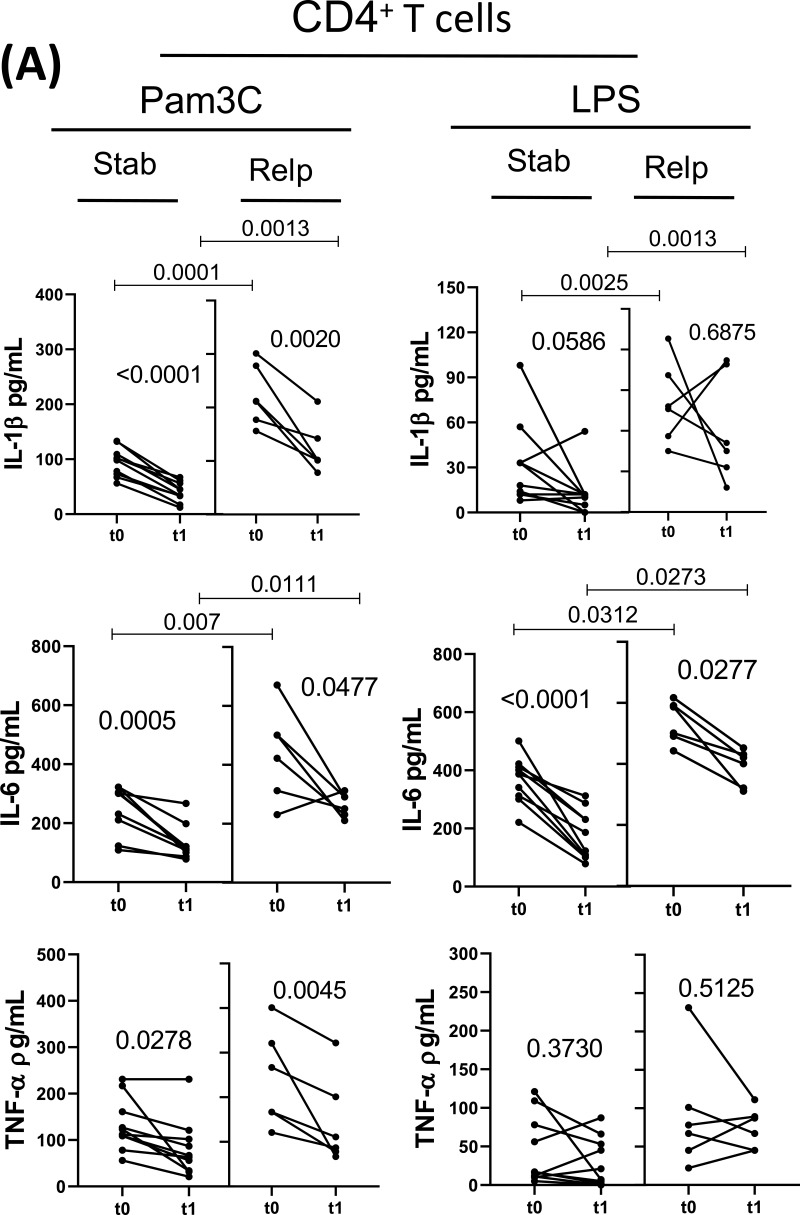
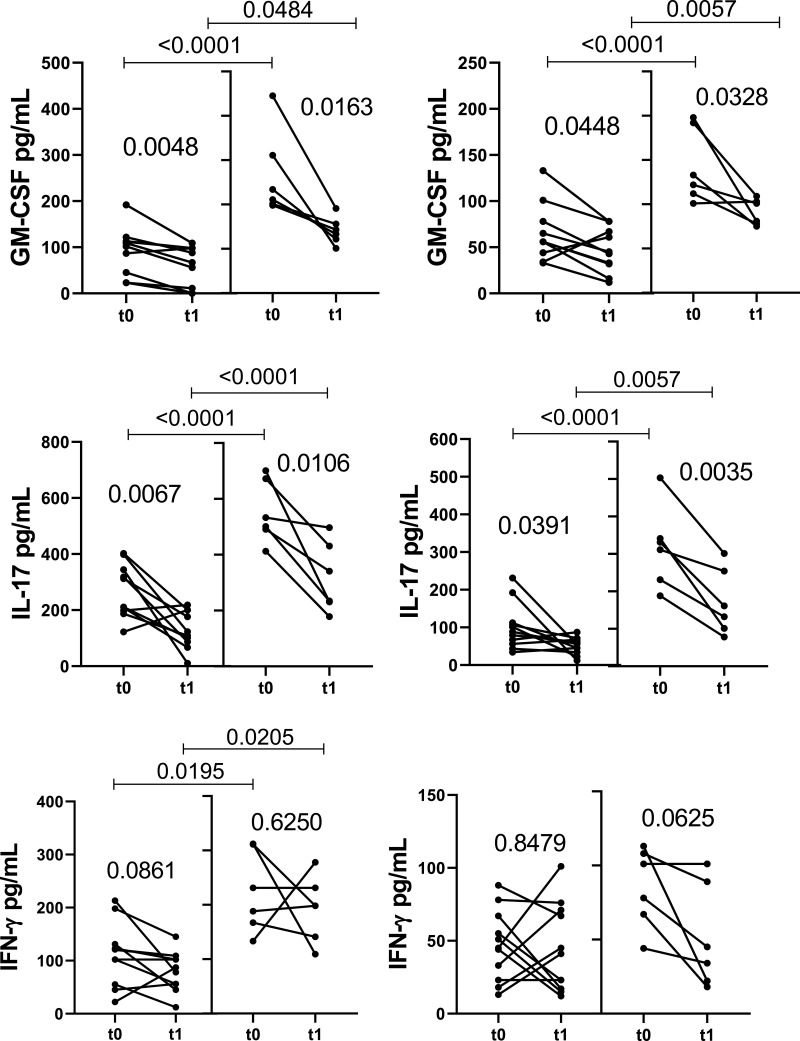
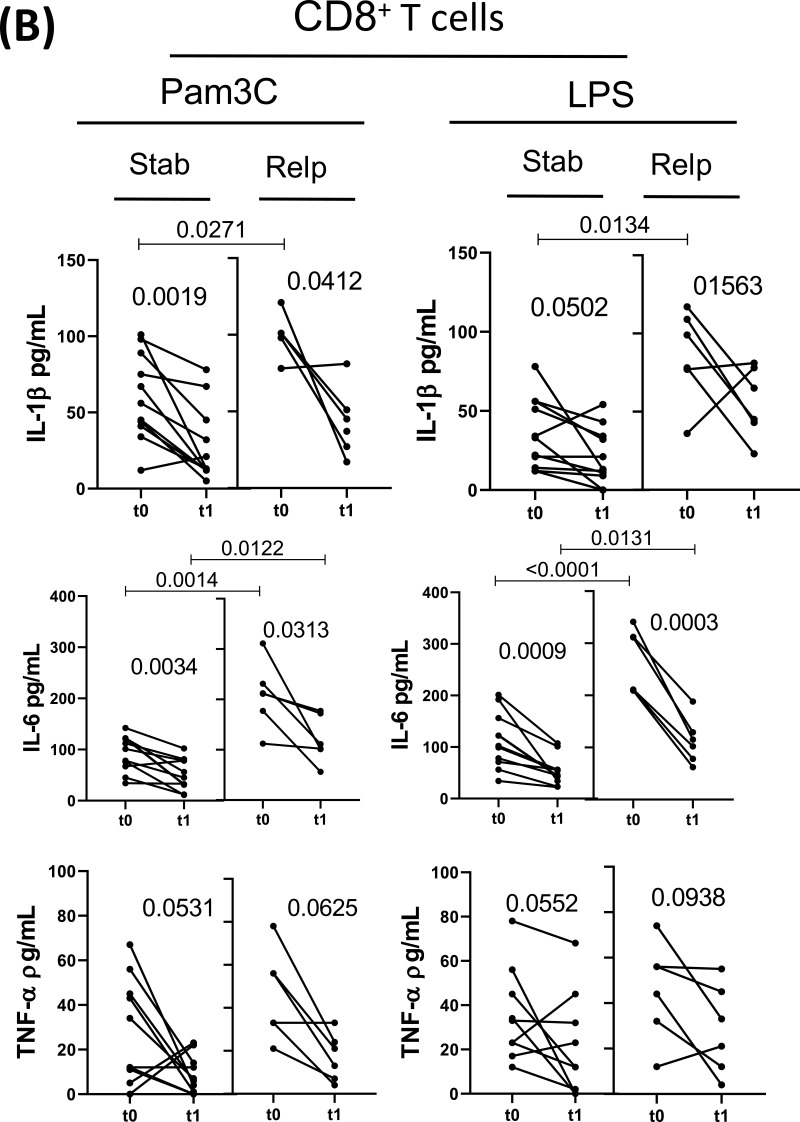
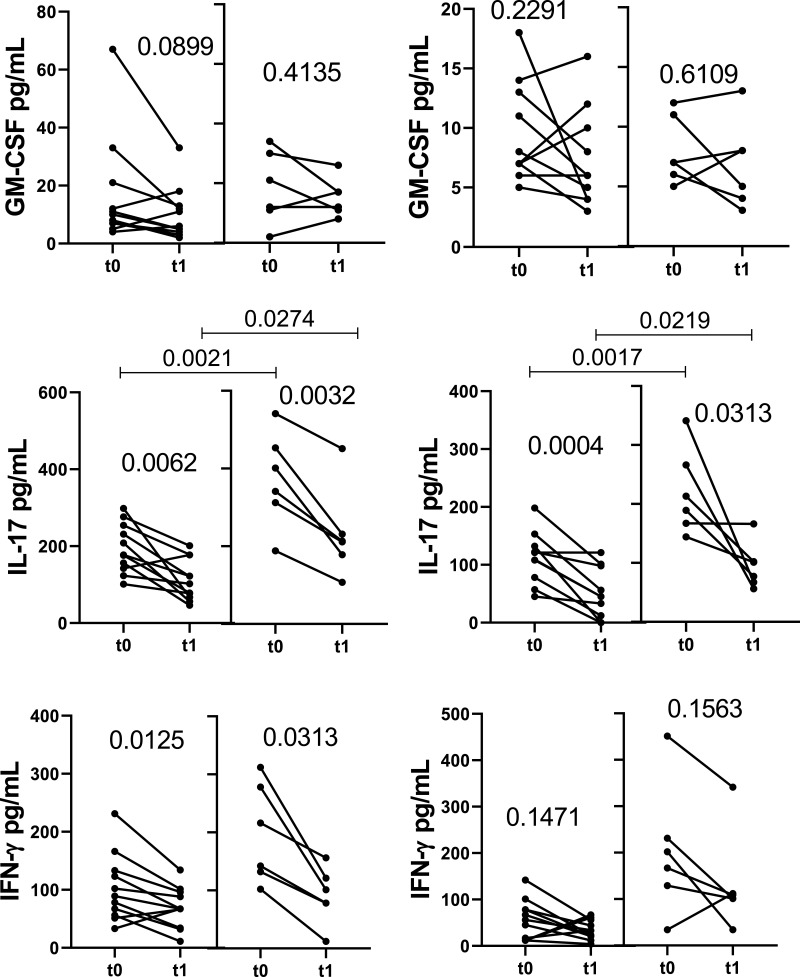
Impact of MS treatment on cytokine production by CD4+ and CD8+ T cells from RRMS patients in response to different TLRs according to the occurrence of relapses. Circulating CD4+ (A) and CD8+ (B) T cells (0.5 x 10⁶/mL), purified from MS patients just before (t0) and 1 year after (t1) DMT, were maintained for 2 days in the presence of Pam3C (1 µg/mL) or LPS (100 ng/mL). The cytokine content in the supernatants from cell cultures was evaluated by Multiplex. The data were stratified according to relapsed (n=6) and non-relapsed (Stab, n=12) patients during follow-up. Data are shown as mean ± SD of seven independent experiments with 2 to 3 samples per experiment. Significance was calculated by comparing Stab versus Relp patients using one-way ANOVA. The p values are indicated in the figure.


