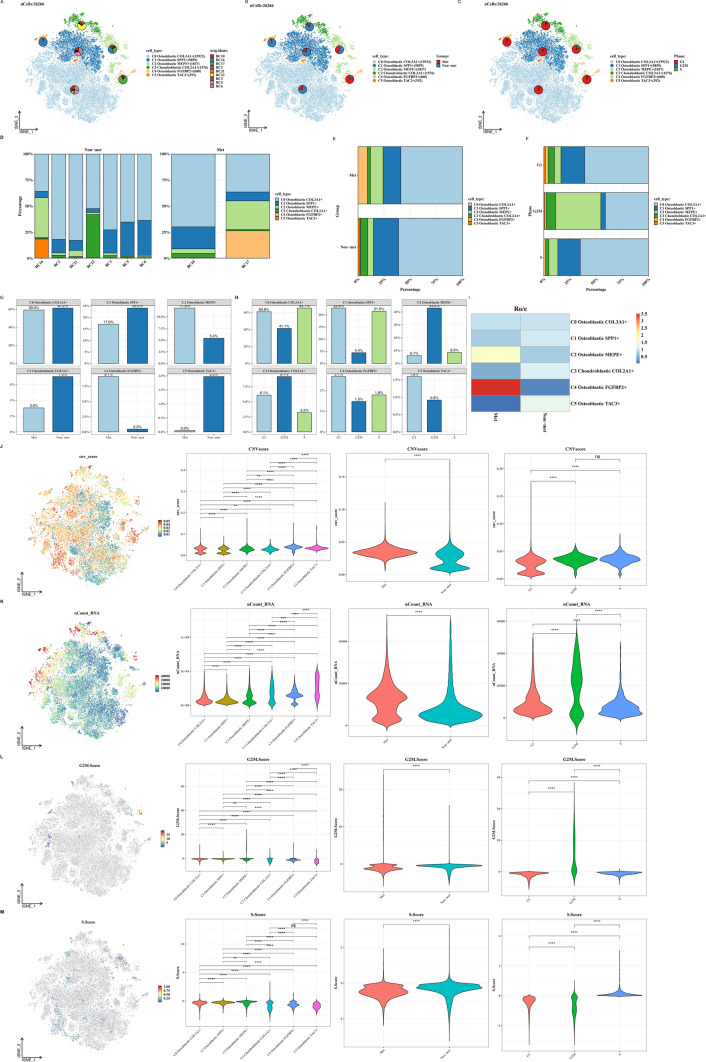
Fig. 3.
Subtyping analysis of tumor cells. A–C t-SNE plots of tumor cells showing the distribution of each clustering cluster across patients, metastatic status, and cell cycle phases. D–H Bar graphs illustrating the proportions of each clustering cluster across patients, metastatic status, and cell cycle phases. I Ratio of observed to expected cell numbers (Ro/e) for each tumor cell subtype to assess tissue preference. J–M Violin plots and t-SNE overlays showing differences in CNV scores, nCount_RNA, G2M.Score, and S.Score across clustering clusters, metastatic status, and cell cycle phases

