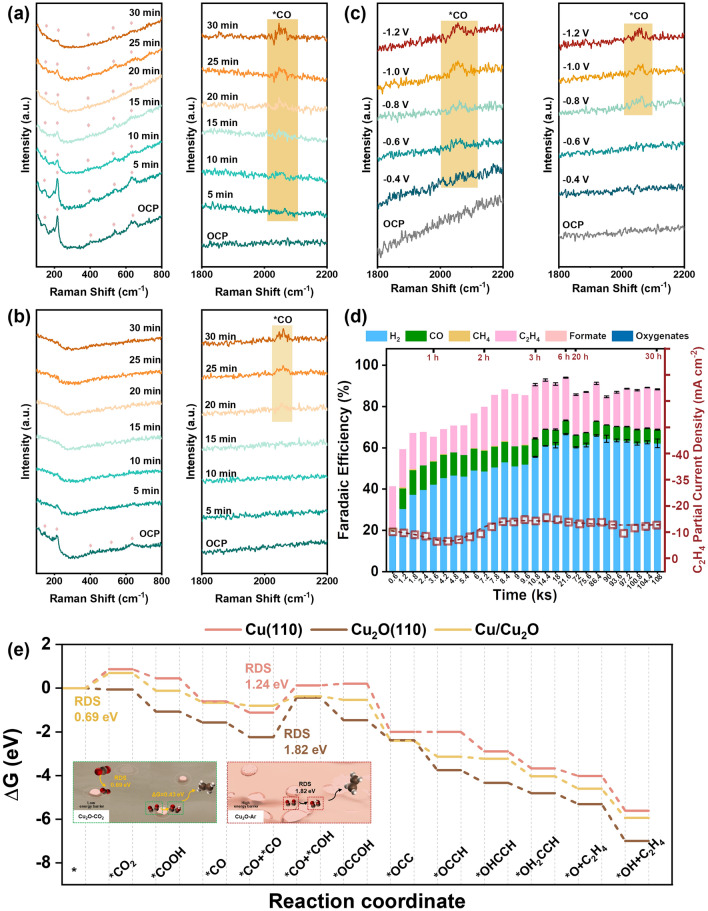
Fig. 5.
Mechanism of feeding-gas-mediated structural evolution. In situ Raman spectra evolution in a time scale with an interval of 5 min for a Cu2O-CO2 and b Cu2O-Ar in the pre-electrolysis process for activation. The applied potential is −1.1 V versus RHE; c In situ Raman spectra evolution with decreasing potential from OCP to −1.2 V versus RHE. The typical peaks of Cu2O are labeled with pink rhombus. The *CO intermediate is highlighted with an orange background. d Partial current density and Faradaic efficiency of the main CO2RR products after activation in O2. Red hollow squares are C2H4 partial current densities at each sampling time. e The reaction energy diagram for CO2RR to C2H4 on Cu (110) slab, Cu2O(110) slab, and Cu/Cu2O interface. (Color figure online)

