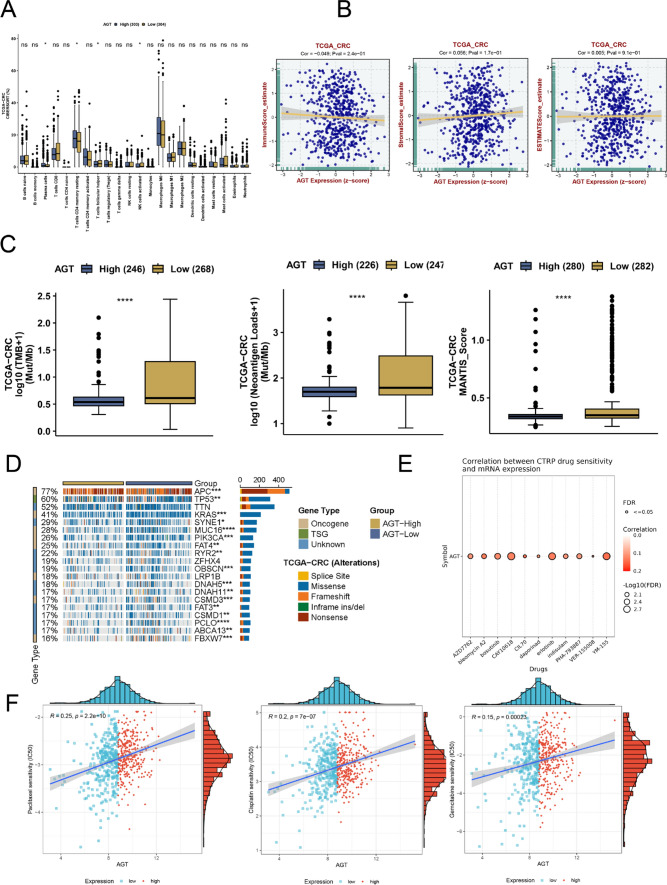
Fig. 2.
A Analysis of immune cell infiltration proportions between high and low AGT expression groups (CIBERSORT); B Correlation analysis of AGT expression with ESTIMATE scores, immune scores, and stromal scores in the TCGA colorectal cancer cohort; C Comparison of tumor mutational burden, neoantigen load, and MANTIS scores between high and low AGT expression groups; D Comparison of somatic mutation frequencies between high and low AGT expression groups; E Spearman correlation between AGT expression and IC50 values from the CTRP database; F Spearman correlation between AGT expression and drug sensitivity IC50 values

