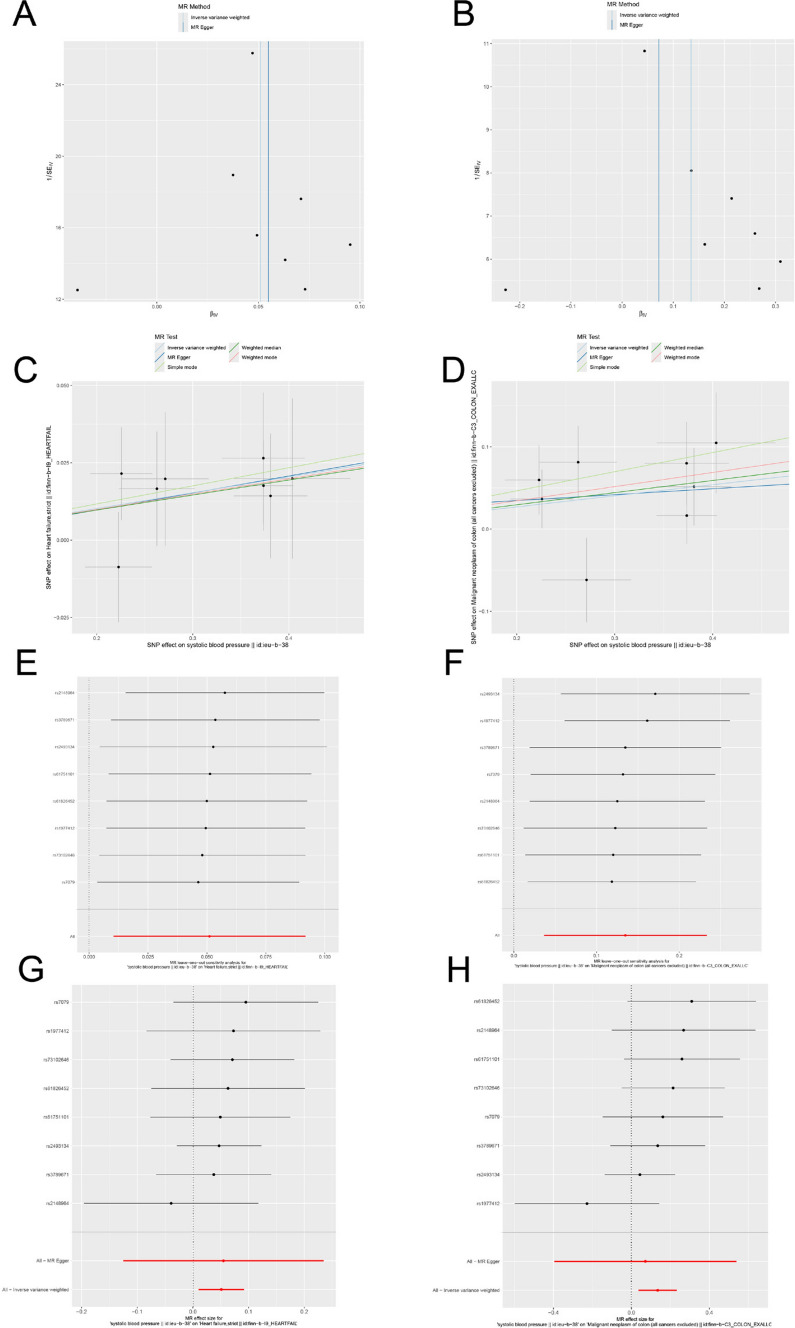
Fig. 6.
A–B Funnel plots demonstrating the symmetry of the causal effect of AGT inhibitor on heart failure and colorectal cancer; The black dots in the figure represent single nucleotide polymorphisms, with the horizontal axis displaying the β values of these polymorphisms, and the vertical axis showing their standard errors. C–D Scatter plots of the five MR analysis methods; The vertical axis denotes the influence of single nucleotide polymorphisms on exposure variables, the horizontal axis delineates their impact on outcome variables. E–F Leave-one-out analysis of statistically significant variations in the causal effects of AGT inhibitor on heart failure and colorectal cancer; The Y-axis corresponds to each excluded rsid number and the ‘all’ condition not excluded by the IVW method. The X-axis corresponds to specific IVW values. G–H Forest plot of each SNP’s causal relationship with heart failure and colorectal cancer

