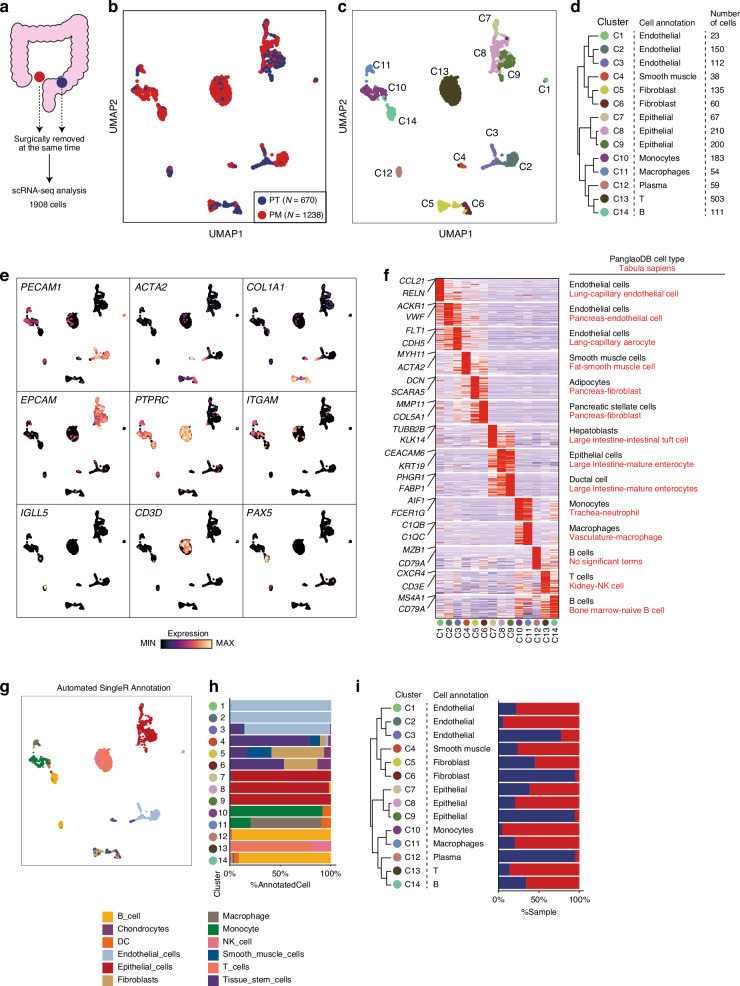
Fig. 1. Single-cell transcriptome profiling of human CRC with PM from a single patient.
a Study design schema. Uniform manifold approximation and projection (UMAP) colored according to samples (b) or clusters (c). d Consensus cell type annotation table for each cluster. Hierarchical clustering was performed using gene expression values of the top 50 cluster-specific genes. e UMAP overlay of selected cell type markers. f Heatmap showing the top 50 cluster-specific genes. Annotations (right) indicate the most significant cell types predicted via gene enrichment analysis using cell type gene databases: PanglaoDB (black) and Tabula Sapiens (red). g UMAP colored according to SingleR automated cell type annotation. h Bar plot showing the proportion of each SingleR-predicted cell type in each cluster. i Bar plot showing the proportion of each sample in each cluster.

