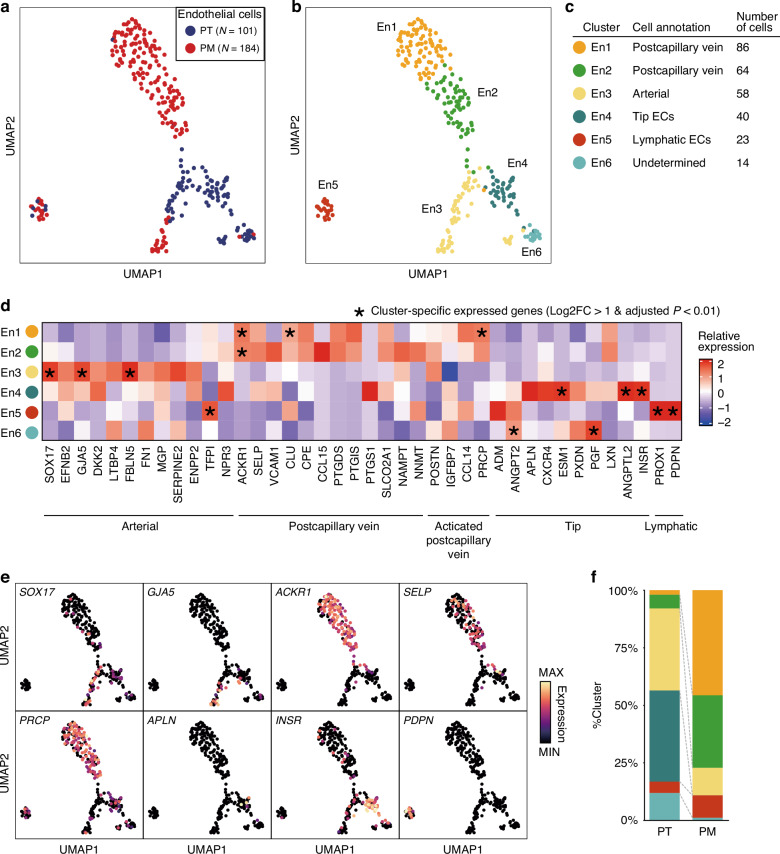
Fig. 2. Subclustering of endothelial cells in the PT and the PM.
UMAP visualization colored according to samples (a) and clusters (b). c Endothelial subtype annotation table. d Heatmap illustrating the relative expression of the endothelial subtype markers in each cluster. Asterisks (*) mean cluster-specific expressed genes (Log2FC > 1 and adjusted P-value < 0.01) compared to other clusters. e UMAP overlay representing expression levels of selected subtype markers. f Bar plot showing the cluster population in each sample.

