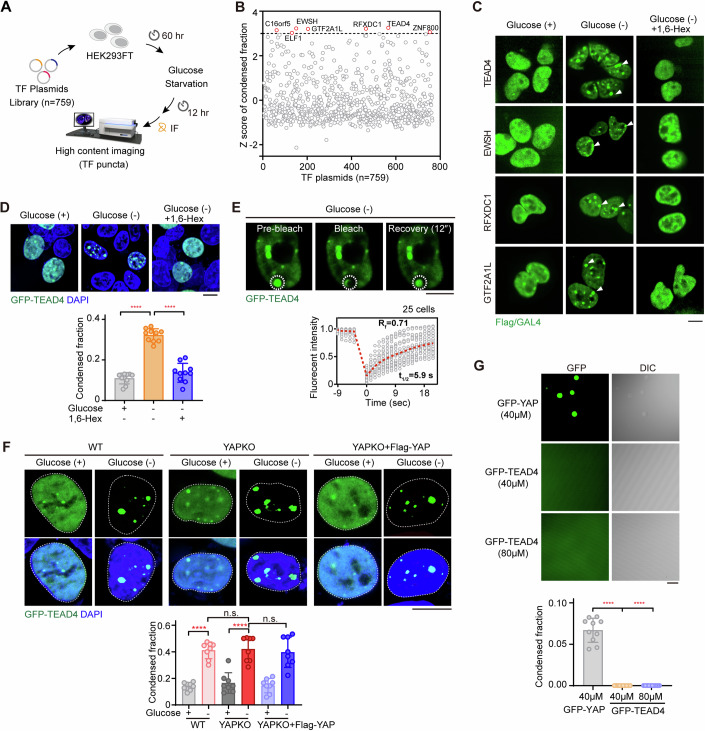
Figure 1. Condensation of TFs is widespread upon glucose deprivation.
(A) Schematic presentation of nuclear condensate screening. HEK293FT cells were transfected with a library of transcription factor (TF, n = 759) plasmids encoding Flag- or Gal4-tagged TF proteins (Dataset EV1). TF condensate was then identified by carrying out immunofluorescence (IF) staining for Flag/Gal4 antibodies after treating the cells with (+) or without (-) glucose for 12 h. Subsequently, using a high-content confocal microscopy and Columbus™ image data storage and analysis system, each cell was imaged and the areas and densities of condensates in the cells were analyzed to calculate the condensed fraction. (B) Z score analysis of the condensed fraction for each TF in HEK293FT cells upon upon their being starved of glucose. The cutoff value was set to 3 standard deviations. (C) Representative images of TF condensates in HEK293FT cells transfected with the indicated plasmids. After being deprived of glucose, HEK293FT cells were treated for 2 h with 1,6-hexanediol (1,6-Hex), a disruptor of condensate formation (n = 3). White arrowheads indicated nuclear condensates. 1,6-Hex, 0.25% v/v (same below). Scale bar, 10 μm. (D) Fluorescence images of GFP-TEAD4 condensates in glucose starvation-treated HEK293FT cells with or without 1,6-Hex. Representative images (upper) and quantification of TEAD4 condensed fraction (lower) are shown. The quantification graph represents the data collected from 10 cells (n = 10). Data shown as means ± SD represent the representative results from two independent experiments. The data were analyzed using one-way ANOVA, followed by the Tukey’s post-hoc test. ****p < 0.0001. Scale bar, 10 μm. (E) FRAP analysis of TEAD4 condensates in HEK293FT cells upon their being deprived of glucose. White circles denote the photobleached spots and nucleoplasm (upper). Three images were taken, during pre-bleach, bleaching and fluorescence recovery (upper). The duration of each FRAP analysis experiment was about 20 s. For each photobleached spot, the fluorescence recovery curve was traced (lower), and this displayed graph represents the data collected from 25 cells expressing GFP-TEAD4 (n = 25). t1/2: fluorescence recovery time; Rf: mobile fraction. Scale bar, 10 μm. (F) Fluorescence images of GFP-TEAD4 condensates in wild-type (WT) cells, YAP-knockout (YAPKO) cells, and YAPKO cells rescued with YAP, with or without glucose deprivation for 12 h. The quantification graph represents the data collected from 8 cells (n = 8). Quantification of the TEAD4 condensed fraction (bottom) is shown. Data shown as means ± SD represent the representative results from two independent experiments. The data were analyzed using one-way ANOVA, followed by the Tukey’s post-hoc test. n.s., no significance; ****p < 0.0001. Scale bar, 10 μm. (G) Droplet formation assay, using differential interference microscopy (DIC), for purified GFP-tagged YAP or TEAD4 proteins. Quantification of condensed fraction is shown and collected from 10 figures (n = 10). Data shown as means ± SD represent the representative results from two independent experiments. The data were analyzed using one-way ANOVA, followed by the Tukey’s post-hoc test. ****p < 0.0001. Scale bar, 10 μm. See also Appendix Fig. S1. Source data are available online for this figure.

