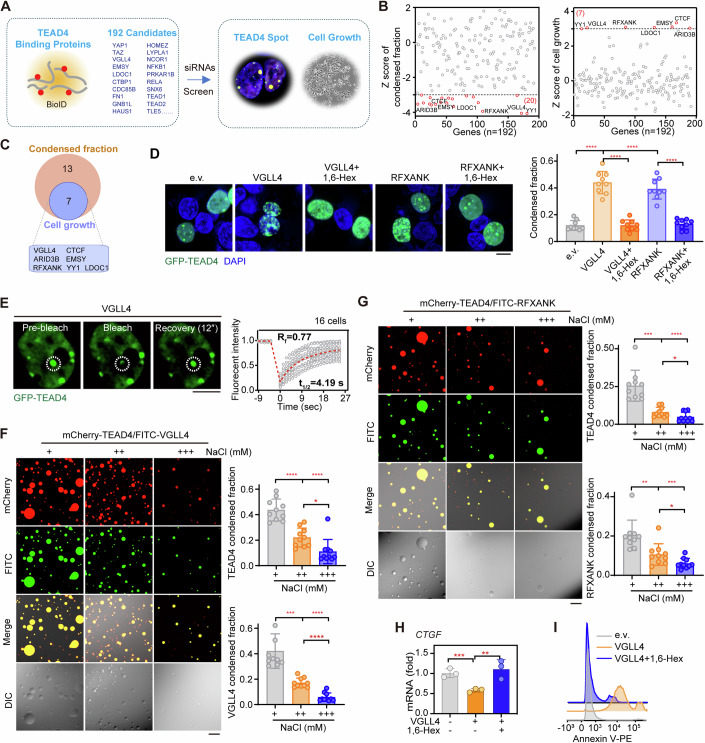
Figure 2. Identification of molecular inducers of TEAD4 condensation.
(A) Schematic diagram of a strategy involving two rounds of screening for molecular inducers of TEAD4 phase separation. The first round utilized a proximity-based labeling system (BioID), which identified 192 candidates as TEAD4-interacting proteins (left). For the second round, individual siRNAs targeting the 192 candidates were used for two types of screening in parallel (based on TEAD4 condensate formation and cell viability, respectively) to identify regulators of TEAD4 LLPS (right). (B) Z score analysis of siRNA screening results, namely TEAD4 condensed fraction and cell growth. The cutoff values were <−3 (TEAD4 condensed fraction, left) and >3 (cell growth, right), respectively. (C) Venn diagram analysis showing the regulators of TEAD4 condensate formation and cell growth. Of the 192 candidates, 7 were identified as having a significant probability of being a regulator of TEAD4 LLPS. (D) Fluorescence images and quantification of TEAD4 condensates in VGLL4- or RFXANK-overexpressing HEK293FT cells that had been treated with or without 1,6-Hex. The quantification graph represents the data collected from 9 cells (n = 9). Quantification of TEAD4 condensed fraction (right) is shown. Data shown as means ± SD represent the representative results from two independent experiments. The data were analyzed using one-way ANOVA, followed by the Tukey’s post-hoc test. ****p < 0.0001. Scale bar, 10 μm. (E) FRAP analysis of TEAD4 condensates in HEK293FT cells transfected with VGLL4. The graph represents the data collected from 16 cells (n = 16). White circles indicated the bleaching condensates. t1/2: fluorescence recovery time; Rf: mobile fraction. Scale bar, 10 μm. (F) In vitro droplet formation assay for VGLL4-TEAD4 mixtures in the presence of different concentrations of NaCl (n = 10). NaCl (+), 100 mM; NaCl (++), 250 mM; NaCl (+++), 500 mM. Quantifications of, respectively, TEAD4 and VGLL4 condensed fractions are shown (right). The quantification graph represents the data collected from 10 images. Data shown as means ± SD represent the representative results from two independent experiments. The data were analyzed using one-way ANOVA, followed by the Tukey’s post-hoc test. *p < 0.05; ***p < 0.001; ****p < 0.0001. Scale bar, 10 μm. (G) In vitro droplet formation assay for RFXANK-TEAD4 mixtures in the presence of different concentrations of NaCl. NaCl (+), 100 mM; NaCl (++), 250 mM; NaCl (+++), 500 mM. Quantifications of, respectively, TEAD4 and RFXANK condensed fractions are shown (right). The quantification graph represents the data collected from 10 images. Data shown as means ± SD represent the representative results from two independent experiments. The data were analyzed using one-way ANOVA, followed by the Tukey’s post-hoc test. *p < 0.05; **p < 0.01; ***p < 0.001; ****p < 0.0001. Scale bar, 10 μm. (H) CTGF mRNA levels in VGLL4-overexpressing HEK293FT cells treated with or without 1,6-Hex (three biological replicates). Data shown as means ± SD represent the representative results from two independent experiments. Significance was assessed using one-way ANOVA, followed by the Tukey’s post-hoc test. **p < 0.01, ***p < 0.001. (I) Annexin V staining of VGLL4-overexpressing cells treated with or without 1,6-Hex (three biological replicates, n = 3). e.v., empty vector. See also Appendix Fig. S2. Source data are available online for this figure.

