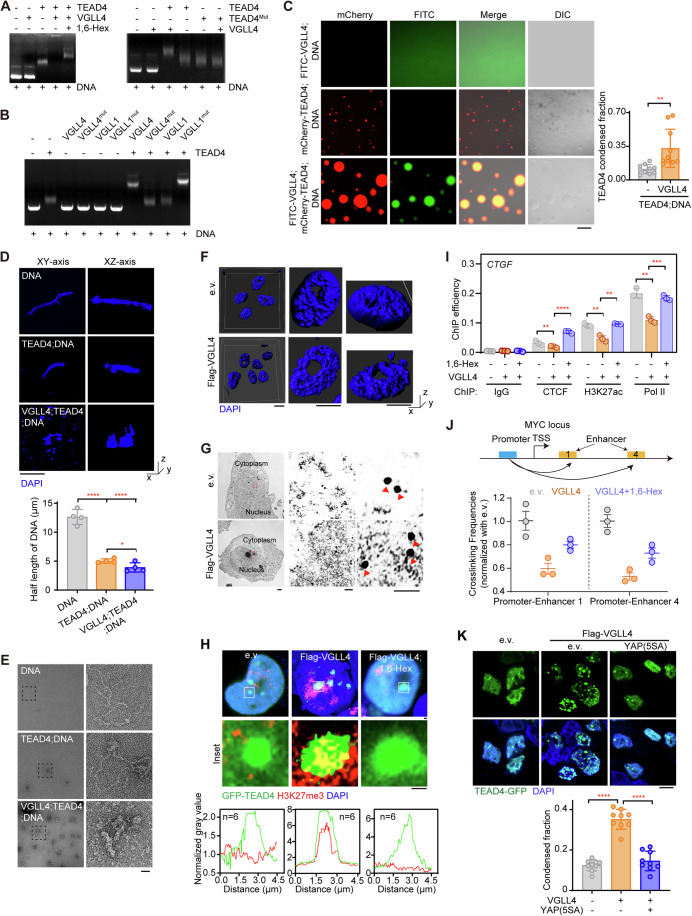
Figure 4. TEAD4 LLPS induces aggregation of DNA to alter transcriptional status.
(A) Electrophoretic mobility shift assay (EMSA) to detect TEAD4-DNA or TEAD4Mut-DNA interaction in the presence or absence of VGLL4 with or without 1,6-Hex. The DNA referred to here was a triple-tandem repeat sequence of M-CAT (5′-TTGCATTCCTCTC-3′) inserted into a pUC-GW-Kan vector. (This same DNA was also used for subsequently described in vitro assays.) TEAD4Mut: S336A/K376A/V389A of human TEAD4. (B) EMSA analysis to detect TEAD4-DNA interaction in the presence of VGLL1, VGLL4, or their mutants described in Fig. 3G. (C) Images showing droplet formation of the DNA with or without indicated proteins (left), and quantification of TEAD4 condensed fraction (right). The quantification graph represents the data collected from 10 images (n = 10). Data shown as means ± SD represent the representative results from two independent experiments. Significance was tested using unpaired t test, **p < 0.01. Scale bar, 10 μm. (D) Representative images showing the DNA organization and appearance in the presence or absence of TEAD4 and VGLL4 proteins. The quantification graph represents the data collected from 4 images (n = 4). The DNA was stained with DAPI. Quantification of half-length of the DNA (bottom) is shown. Data shown as means ± SD represent the representative results from two independent experiments. Significance was tested using one-way ANOVA, followed by the Tukey’s post-hoc test. *p < 0.05; ****p < 0.0001. Scale bar, 100 nm. (E) Scanning electron microscopy images of the DNA in the presence or absence of TEAD4 and VGLL4 proteins. The partially enlarged detailed view of the structure of the DNA is shown. Scale bar: 100 nm. (F) Representative images of chromatin with DAPI staining captured using N-SIM. Scale bar, 100 nm. (G) Immune electron microscopy (IEM) images showing TEAD4 particles in HEK293FT cells transfected with VGLL4. Red arrows denote TEAD4 particles containing colloidal gold-bound anti-TEAD4 antibody. Scale bars: 10 μm, 1 μm, and 10 nm for, respectively, the left, middle and right images. (H) Immunofluorescence staining (upper and middle, representative images with zoom-in; lower, quantification of fluorescence intensity of 6 cells with indicated color scheme) of GFP-TEAD4 and H3K27me3 in VGLL4-overexpressing cells treated with or without 1,6-Hex. Scale bar, 1 μm. (I) Chromatin immunoprecipitation-quantitative PCR (ChIP-qPCR) analysis for enrichment of CTCF, H3K27ac and polymerase II (Pol II) on CTGF promoter in VGLL4-overexpressing HEK293FT cells with or without 1,6-Hex (three biological replicates, n = 3). Data shown as means ± SD represent the representative results from two independent experiments. Significance was tested using one-way ANOVA, followed by the Tukey’s post-hoc test. **p < 0.01; ***p < 0.001; ****p < 0.0001. (J) Schematic for and results of a chromosome conformation capture (3C)-based method used to assess the relative distances and potential interactions between the MYC promoter and its enhancers in VGLL4-overexpressing HEK293FT cells treated with or without 1,6-Hex (three biological replicates, n = 3). Data shown as means ± SD represent the representative results from two independent experiments. (K), Fluorescence images of TEAD4 condensates in VGLL4-expressing HEK293FT cells co-expressing e.v. or YAP(5SA) (top), and quantification of TEAD4 condensed fraction (bottom). The quantification graph represents the data collected from 9 cells (n = 9). Data shown as means ± SD represent the representative results from two independent experiments. Significance was tested using one-way ANOVA, followed by the Tukey’s post-hoc test. ****p < 0.0001. YAP(5SA): S61A, S109A, S127A, S164A, S381A of YAP. Scale bar, 10 μm. See also Appendix Fig. S4. Source data are available online for this figure.

