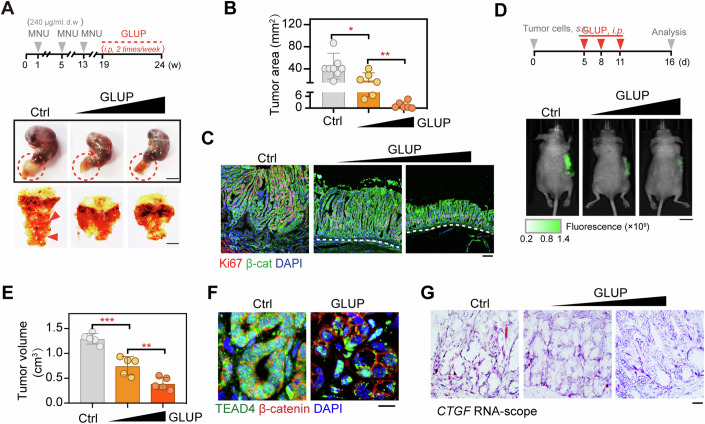
Figure 7. GLUP displays a strong antitumor effect.
(A) MNU-induced tumor formation in GLUP-treated mice. Experimental workflow of the treatment of MNU-administrated GC mice with 1 mg/kg or 5 mg/kg GLUP via subcutaneous injection (upper, same below for GLUP treatment). In the workflow, gray arrows represent, respectively, first, second, and third cycles of MNU treatment each with a 2-week duration, and orange dashed line represents GLUP treatment with a 5-week duration. d.w., drinking water. Red circle indicated the tumor area. Macroscopic dissection view of the stomach (opened along the greater curvature) from each of MNU-induced mice with or without GLUP (lower). Red arrowhead indicated the tumor position. Scale bar, 1 cm. Data represent the representative results from two independent experiments. (B) Tumor areas of MNU-induced GC mice treated or not treated with GLUP (n = 8/group). Data are presented as means ± SD. Significance was tested using one-way ANOVA, followed by the Tukey’s post-hoc test. *p < 0.05, **p < 0.01. (C) Dual immunofluorescence staining for Ki67 and β-catenin (β-cat) in the gastric mucosa of MNU-induced GC tumors in control mice and those treated with GLUP. Scale bar, 10 μm. Data represent the representative results from two independent experiments. (D) Xenograft tumor formation assay to assess the therapeutic efficacy of 1 mg/kg or 5 mg/kg GLUP treatment (n = 5/group). A schematic illustration of the experimental workflow for a subcutaneous tumor mouse model is shown (upper). GFP-expressing HGC-27 cells were subcutaneously injected into nude mice and allowed to grow for 5 days before the resulting tumors were treated with GLUP. Representative photographs of GLUP-treated tumors are also shown (lower). Scale bar, 1 cm. Data represent the representative results from two independent experiments. (E) Measured volumes of tumors in (D) (n = 5/group). Data are presented as means ± SD. Significance was tested using one-way ANOVA, followed by the Tukey’s post-hoc test. **p < 0.01, ***p < 0.001. (F) Immunofluorescence of β-catenin and TEAD4 in tumor tissues of mice treated or not treated with GLUP. Scale bar, 10 μm. (G) RNA-scope of CTGF in the tumor tissues of mice treated or not treated with GLUP. Scale bar, 10 μm. See also Appendix Fig. S7. Source data are available online for this figure.

