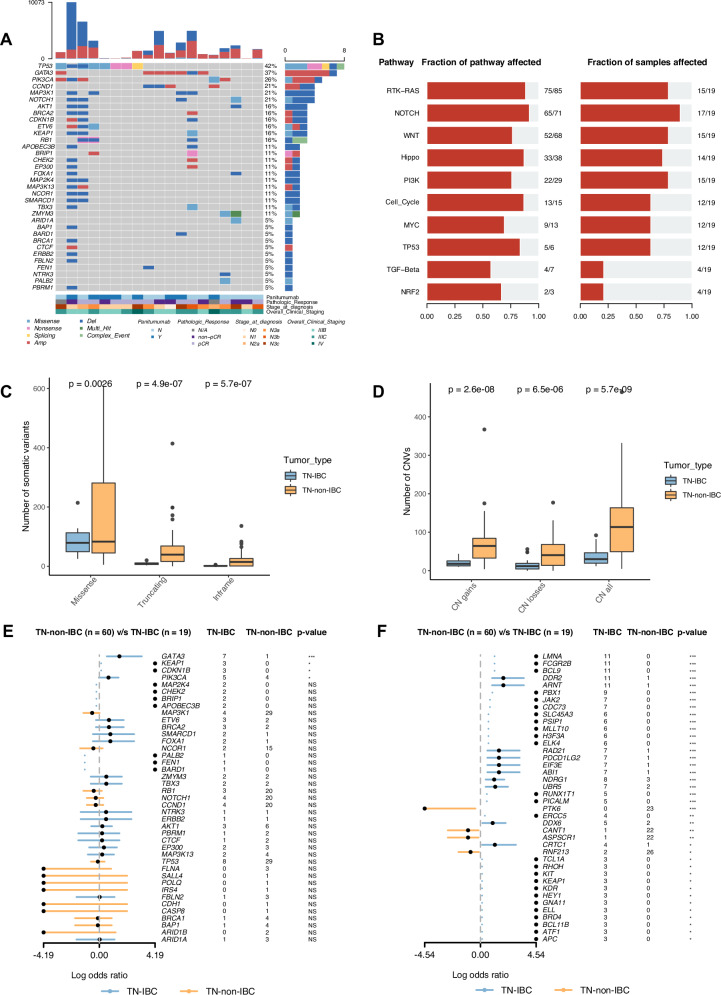
Fig. 2. Somatic alterations identified in TN-IBC and comparison with TN-non-IBC.
A Somatic alterations identified in breast cancer driver genes in TN-IBC. Gene names and relative frequency of mutations are reported in the double y-axis. Top: bar graph defining the total number of different types of somatic alterations in each patient; bottom: annotation for PmAb treatment, pathologic response, stage at diagnosis, and overall clinical staging. B Altered oncogenic pathways affected by somatic alterations in TN-IBC. C,D Number of somatic variants, including missense, truncating, and inframe variants (C), and CNV load, including copy number gains, losses, and both (D), in TN-IBC and TN-non-IBC. E,F Enrichment of somatic alterations in breast-cancer-associated genes (E) and cancer hallmark genes (F) in TN-IBC compared to TN-non-IBC. *P < 0.05; **P < 0.01; ***P < 0.001; NS, not significant. In C and D, the center line represents the median of the data. The edges of the box correspond to the 75th percentile and the 25th percentile respectively, showing the interquartile range (IQR). The whiskers extend to the largest and smallest values within 1.5 times the IQR from the 25th and 75th percentiles. Outliers, defined as data points beyond the whiskers, are plotted individually as dots.

