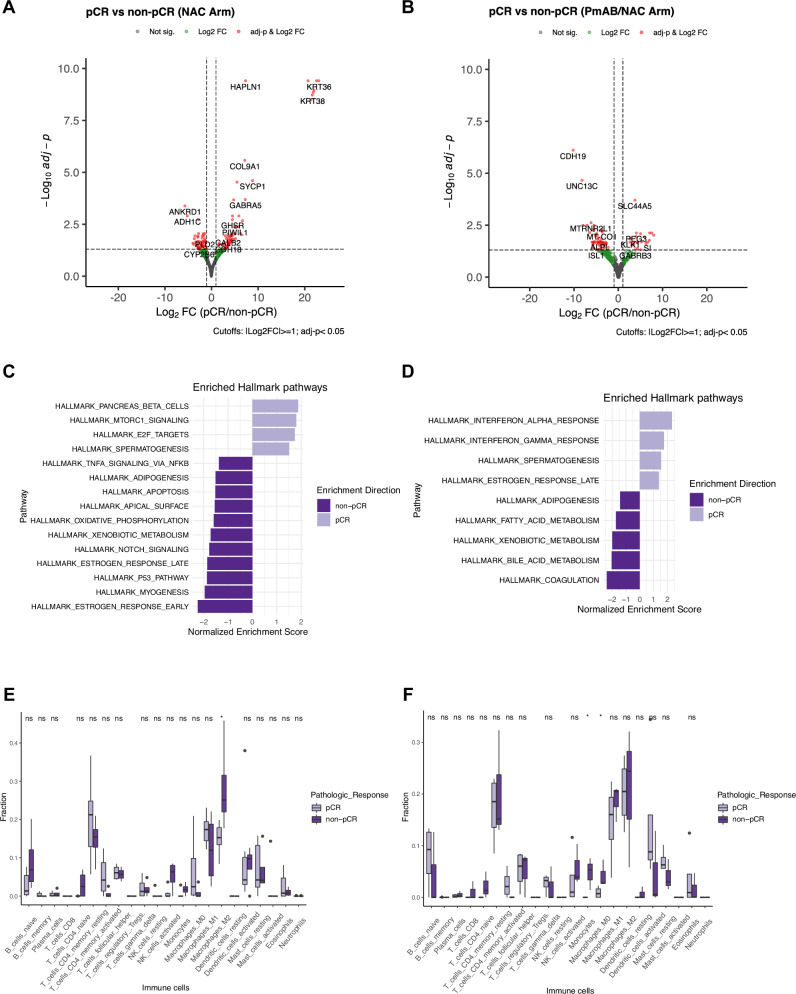
Fig. 5. Comparison of gene expression and immune cell composition between tumor samples collected from TN-IBC patients who did and did not have pCRs in the NAC and PmAb/NAC arms.
A,B Volcano plots of differentially expressed genes with Log2FC ≥ 1 or ≤−1 and adj-p < 0.05 in tumor samples collected from TN-IBC patients who did and did not have pCRs in the NAC (A) and PmAb/NAC (B) arms. C,D GSEA of the significantly enriched hallmark pathways in tumor samples collected from TN-IBC patients who did and did not have pCRs in the NAC (C) and PmAb/NAC (D) arms. E,F Comparison of the immune cell composition in tumor samples collected from TN-IBC patients who did and did not have pCRs in the NAC (E) and PmAb/NAC (F) arms. *P < 0.05; NS, not significant. In E and F, the center line represents the median of the data. The edges of the box correspond to the 75th percentile and the 25th percentile respectively, showing the interquartile range (IQR). The whiskers extend to the largest and smallest values within 1.5 times the IQR from the 25th and 75th percentiles. Outliers, defined as data points beyond the whiskers, are plotted individually as dots.

