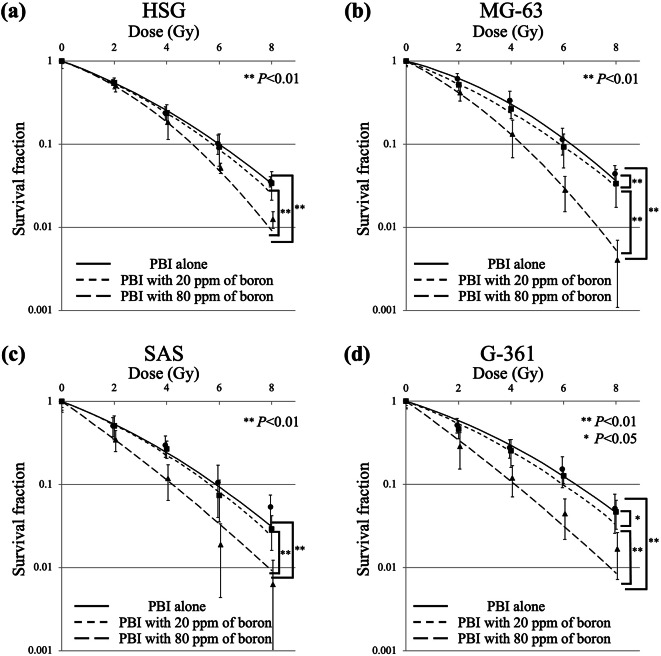
Fig. 2.
Survival curves for (a) HSG, (b) MG63, (c) SAS, and (d) G-361 cells after proton beam irradiation alone (solid line), proton beam irradiation with 20 ppm of boron (dash-dotted line), and proton beam irradiation with 80 ppm of boron (dashed line). Data are presented as the mean ± standard deviation, fitted to the linear-quadratic model. Significantly different at * P < 0.05 and ** P < 0.01. G-361 human malignant melanoma cell, HSG human salivary gland tumor cell, MG63 human osteosarcoma cell, PBI proton beam irradiation, SAS human tongue squamous-cell carcinoma cell.

