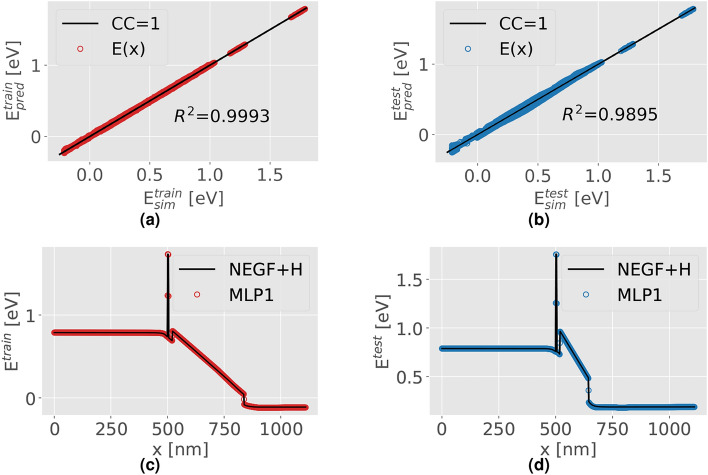
Fig. 3.
The correlation for each point of the PP, denoted as E, between the NEGF+H simulations and MLP1 predictions is depicted in the top figures for the training (a) and test (b). The Pearson’s coefficient (CC) equal to 1 shows the perfect correlation line between prediction and simulation. An example of the reconstructed PP of MLP1 predictions in comparison to NEGF+H simulations, for randomly selected profiles, is illustrated in the bottom figures from both the training subset (c) and the test subset (d). The variable x is the distance from the start of the emitter contact.

