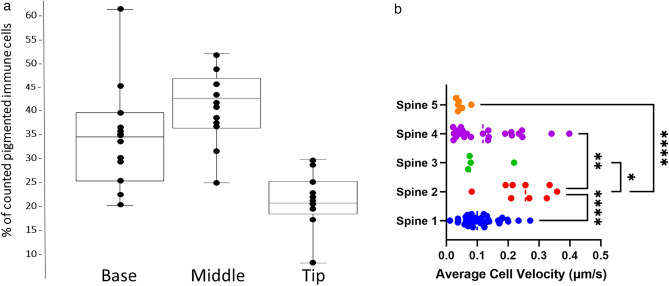
Fig. 13.
(A) Immune cells were counted in fifty-micron swaths of demineralized spines at the base, in the middle, and at the tip, and the percent of these counted cells in each region was calculated. (B) Velocity of individual presumptive red-spherule cells in intact spines from 5 spines of different Lytechinus variegatus individuals. Each dot on the graph represents an individual cell’s average velocity over the course of the time-lapse video. Significant p values between spines by One-way ANOVA are indicated with stars (*= 0.0282, **= 0.0023, ****= < 0.0001).

