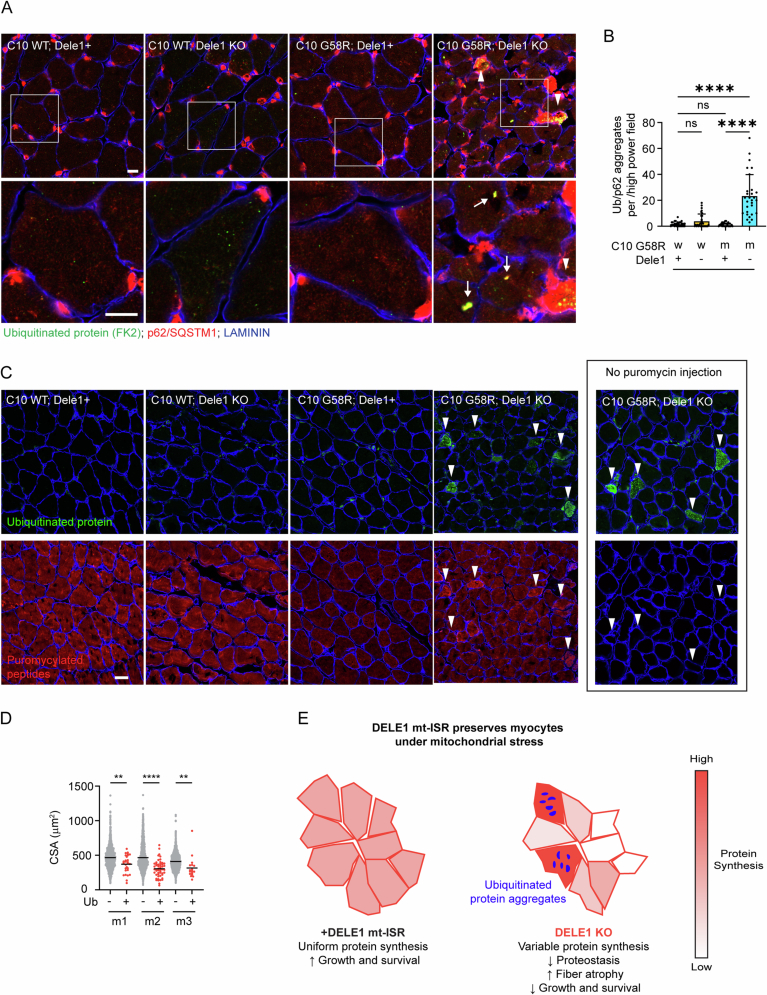
Figure EV5. The Dele1 mt-ISR prevents disruptions in translation-associated proteostasis in skeletal muscle.
(A) Representative immunofluorescence images of gastrocnemius muscle from C10 G58R; Dele1 KO and indicated littermates triple-stained for the ubiquitinated protein marker, FK2 (green), the aggregate adapter protein p62 (red) and laminin (blue). In the C10 G58R; Dele1 KO genotype, a subset of fibers displayed FK2 and p62 colocalized in individual (white arrows) or confluent aggregates (arrowheads), suggesting proteostatic collapse. High power (60X) views of the boxed areas are shown in bottom panels. Scale bars = 10 μm. Note: animals were not injected with puromycin in this experiment. (B) Quantification of (A). Aggregates positive for both FK2 and p62 were counted in 10 high power (60X) fields. N = 3 mice per genotype with 29 or 30 fields counted total per sample. High-power (60X) field size is 132.58 μm × 132.58 μm. Statistical analysis was performed using the Kruskal–Wallis test with Dunn’s multiple comparisons test, as the data distribution was non-parametric. **** indicates p ≤ 0.0001 and “ns” not significant. Adjusted p-values are >0.9999 for WT vs. Dele1 KO, >0.9999 for WT vs. C10 G58R, <0.0001 for WT vs. C10 G58R; Dele1 KO, and <0.0001 for C10 G58R vs. C10 G58R; Dele1 KO. (C) Representative immunofluorescence images of gastrocnemius muscle from P28 C10 G58R; Dele1 KO mice and indicated littermates injected with puromycin 30 min prior to sacrifice as in (Fig. 7E). Muscle cross-sections were immunostained for the ubiquitinated protein marker, FK2 (green), puromycin (red), and laminin (blue). Arrowheads indicate muscle fibers containing many or confluent aggregates of ubiquitinated protein that were also co-stained for elevated puromycylated polypeptides. N = 1 mouse for each genotype except for P28 C10 G58R; Dele1 KO mice for which N = 3 mice. Scale bars = 20 μm. (D) Quantification of myofiber cross-sectional area (CSA) as in (Fig. 7E). The average CSA for Ub+ and Ub- myofiber is shown in graph separately for three G58R; Dele1 KO mice (m1–3) in graph. N = 3 mice with 10 high power fields counted per mouse. Statistical analysis was performed using the Kruskal–Wallis test with Dunn’s multiple comparisons test, as the data distribution was non-parametric. ** and **** indicates p ≤ 0.01 and 0.0001, respectively, and “ns” not significant. P-values (from left to right) are 0.0055, <0.0001, and 0.0016. (E) Schematic summarizing data showing that Dele1 KO results in variable protein synthesis, decreased proteostasis, and increased muscle fiber atrophy within skeletal muscle undergoing mitochondrial stress. We hypothesize that these changes are responsible for the decreased growth and survival in MM models with early mitochondrial stress, in the absence of the Dele1 mt-ISR.

