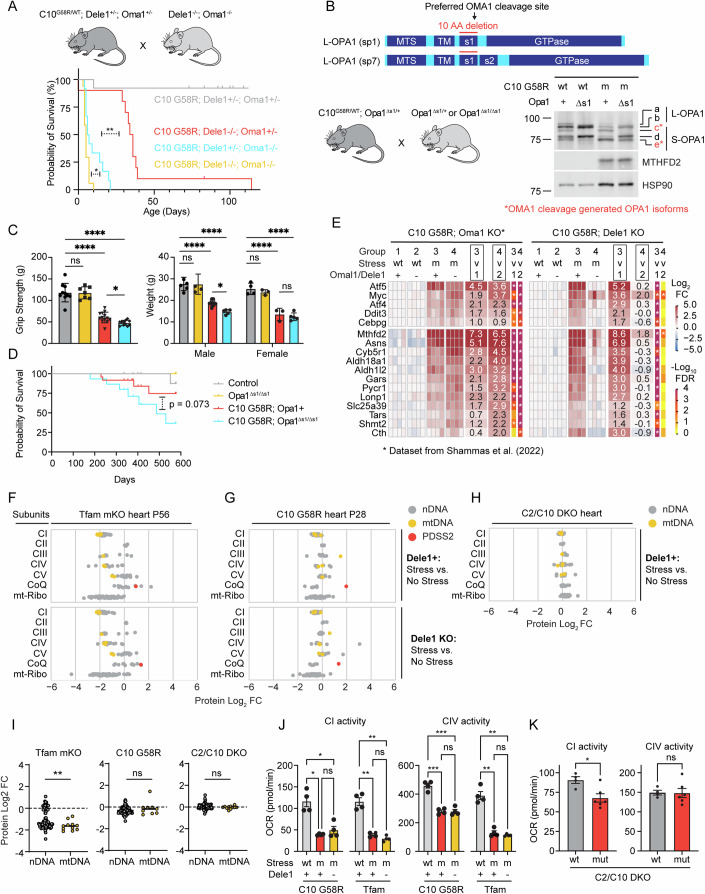
Figure 2. The DELE1 mt-ISR mediates only some of the protective OMA1 stress response and does not reverse underlying OXPHOS defect.
(A) Illustration of breeding strategy to create the cohort. Survival analysis for C10 G58R; Oma1 KO; Dele1 KO triple mutant mice and their littermates. Statistical analysis performed with Log-rank (Mantel-Cox) test. *, **** indicate p ≤ 0.05 and p ≤ 0.0001, respectively. From left to right, p-values are 0.0127 and <0.0001. (B) Schematic demonstrating generation of Opa1∆s1/∆s1 mice through a 30 bp deletion removing the OMA1 preferred cleavage site, s1, from OPA1. Wild-type splice variants 1 and 7 (sp1 and sp7) contain the s1 site. (top); and OPA1 cleavage patterns of C10 G58R; Opa1∆s1/∆s1 mice and control mouse heart lysates (bottom, right). (C) Grip strength (left) and body weights (right) of C10 G58R; Opa1∆s1/∆s1 and their littermates at 13 weeks. Gray bar = control; yellow bar = Opa1∆s1/∆s1; red bar = C10 G58R; blue bar = C10 G58R; Opa1∆s1/∆s1. Each dot represents one mouse. Statistical analysis for grip strength (left graph) performed with Welch ANOVA and Dunnett’s T3 multiple comparisons test. N ≥ 7 mice per group (genotype/age/sex). Adjusted p-values are 0.0243 (bottom row), >0.9999 (second from bottom), <0.0001 (third from bottom), <0.0001 (top row). (right) Statistical analysis for body weight performed with an ordinary two-way ANOVA with Tukey’s multiple comparisons test, with a single pooled variance. (for males) adjusted p-values are 0.0298 (bottom), 0.9997(second from bottom), <0.0001 (third from bottom), <0.0001 (top). (for females) adjusted p-values are 0.9241 (bottom), 0.8223 (second from bottom), <0.0001 (third from bottom), <0.0001 (top). In all graphs, *, **** indicates p ≤ 0.05 and p ≤0.0001, respectively, “ns” not significant. Bar and error bars indicate mean and SD, respectively. (D) Survival analysis of C10 G58R; Opa1∆s1/∆s1 mice and their littermates. Statistical analysis performed with Log-rank (Mantel-Cox) test. (E) Gene expression analysis of prespecified ISR genes from C10 G58R; Dele1 KO mice and littermates at P28 compared to a previously published dataset from 14-week-old C10 G58R; Oma1 KO mice (Shammas et al, 2022). Data from same C10 G58R; Dele1 KO dataset also appears in (Appendix Figs. S1B; Figs. 4A–D,G and 6C). wt = wild type; m = mutant. (F) Scatterplot depicting relative abundance of OXPHOS complexes I–V subunits, Coenzyme Q biosynthesis pathway, and mito-ribosome in Tfam mKO; Dele1 KO mice and littermates detected from crude mitochondrial preparations of mouse hearts. See also Appendix Fig. S4A for statistical analysis. N = 4 mice per group. Data from this proteomics dataset also appears in Fig. 4F and Appendix Fig. S7B,C,E. (G) Scatterplot depicting relative abundance of OXPHOS complexes I–V subunits, Coenzyme Q biosynthesis pathway, and mito-ribosome in C10 G58R; Dele1 KO mice and littermates detected from crude mitochondrial preparations of mouse hearts. See also Appendix Fig. S4A for statistical analysis comparing differences in subunit expression between genotypes. N = 4 mice per group. Data from this proteomics dataset also appears in Appendix Fig. S1D, Fig. 4E,G, and S7C,D. (H) Scatterplot depicting relative abundance of OXPHOS complexes I–V subunits, Coenzyme Q biosynthesis pathway, and mito-ribosome in C2/C10 DKO and unrelated age-matched WT animals detected from crude mitochondrial preparations of mouse hearts. See also Appendix Fig. S4A for statistical analysis. N = 4 mice per group. (I) Graphs compare protein abundance of mtDNA- vs. nDNA-encoded OXPHOS subunits from data in (F–H). Statistical analysis for Tfam (left graph) was performed using the Mann–Whitney test, as the data were not normally distributed, and statistical analysis for C10 G58R (middle graph) and C2/C10 DKO (right graph) were performed using the unpaired Welch’s t-test. P-values = 0.0087 (left graph), 0.4005 (middle graph), and 0.1508 (right graph). In all graphs, ** indicates p ≤ 0.01 and “ns” not significant. Bars indicate median values. (J, K) Seahorse oxygen consumption-based measurements of CI and CIV activities from frozen mitochondria isolated from hearts of the indicated genotypes. wt = wild type; m or mut = mutant. Statistical analysis performed with Welch ANOVA and Dunnett’s T3 multiple comparisons test (J) and unpaired Welch’s t-test (K). In (J, left most graph) p-values = 0.02304 and 0.6378 (bottom row, left to right) and 0.0188 (top row); in (J, second graph from left) p-values = 0.0032 and 0.1719 (bottom row, left to right) and 0.0022 (top row); in (J, third graph from left) p-values = 0.0006 (bottom), >0.9999 (middle) and 0.0006 (top)); in (J, right most graph) p-values = 0.0029 (bottom), 0.5977 (middle) and 0.0054 (top). In (K), p-value = 0.0102 (left graph) and 0.9437 (right graph). In all graphs, *, **, and *** indicate p ≤ 0.05, p ≤ 0.01, p ≤ 0.001, respectively, and “ns” not significant. Bars indicate mean values and error bars SEM. Source data are available online for this figure.

