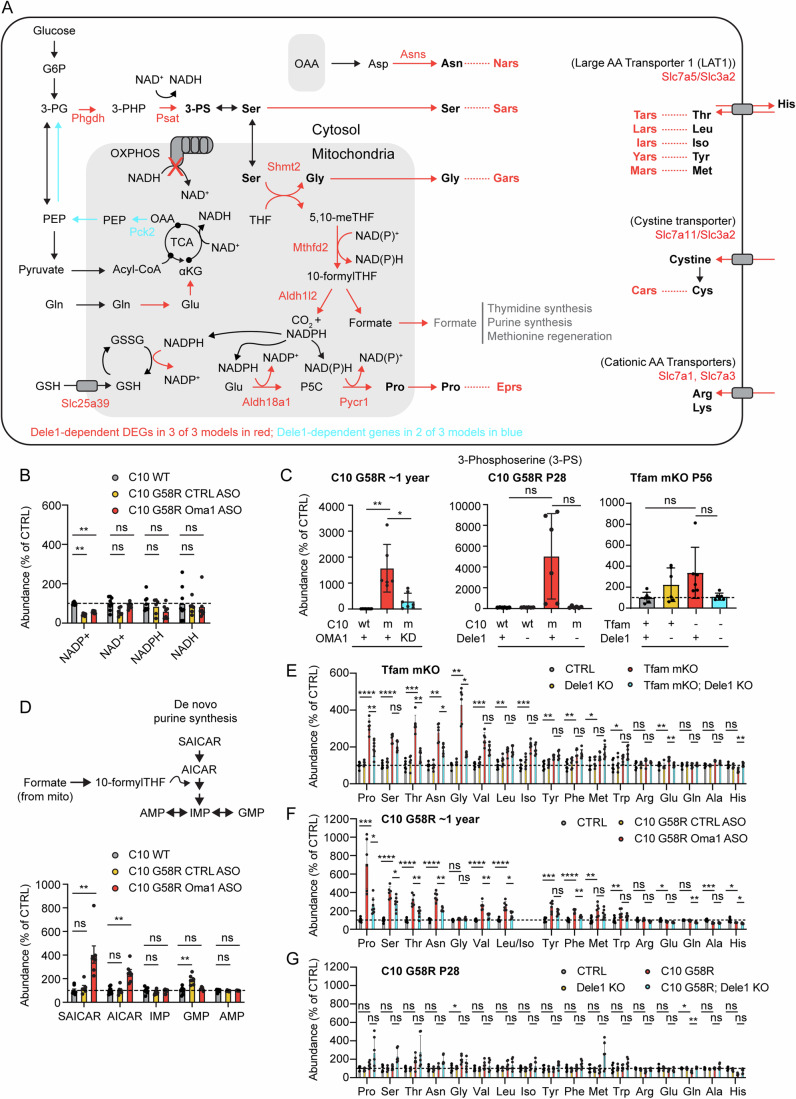
Figure 5. DELE1 mt-ISR maintains anabolic mitochondrial pathways, including for protein synthesis intermediates.
(A) Diagram depicts major intersections among 22 (out of 51) pro-anabolic genes that are upregulated as part of the DELE1 mt-ISR heart signature (gene names in red). Additional genes (in blue) were identified in 2/3 models. Key pathways intersecting mitochondria include those for the biosynthesis of glycine, serine, proline, and asparagine. Upregulation of these pathways is coordinated with upregulation of genes for the corresponding aminoacyl tRNA synthases. (B) Individual data for levels of NAD+, NADH, NADP+, and NADPH detected by untargeted metabolomics of heart tissue from ~1-year-old (319–411 days) C10 G58R mice injected with CTRL or Oma1 ASOs or wild-type littermates injected with PBS for 6 weeks prior to sacrifice. Data is from the named dataset that also appears in Dataset EV4. Statistical analysis for the metabolomics dataset is described in Methods. Significance indicated on graph, tested using two-sided Student’s t-tests, was corrected for multiple comparisons across all metabolites in the dataset, using the Benjamini–Hockberg procedure. Error bars indicate the SD. From left to right, adjusted p-values = 2.58E−07, 0.04948, 0.6861, 0.8274 (bottom row) and 1.08E−06, 0.5264, 0.1282, 0.7702 (top row). ** indicates p ≤ 0.01 and “ns” not significant. (C) Levels of 3-phosphoserine measured by untargeted proteomics in adult C10 G58R mice as in (B) or by targeted metabolomics in P28 C10 G58R mice and P56 Tfam mKO mice. W denotes wild type; m denotes mutant. Data is from the named dataset that also appears in Dataset EV4 (for C10 G58R ~ 1 year) and Dataset EV5 (for P28 C10 G58R and Tfam mKO). Statistical analysis for the metabolomics dataset is described in Methods. Significance indicated on graph, tested using two-sided Student’s t-tests, was corrected for multiple comparisons across all metabolites in the dataset, using the Benjamini–Hockberg procedure. Error bars indicate the SD. (In left graph) adjusted p-values = 0.001630 and 0.05766 (left to right); (in middle graph) adjusted p-values = 0.3344 and 0.2107 (left to right); and (in right graph) adjusted p-values = 0.1039 and 0.2845 (left to right). *, ** indicates p ≤ 0.05 and p ≤ 0.01, respectively, and “ns” not significant. N ≥ 6 mice per group (genotype). (D) Levels of intermediates of de novo purine synthesis that are sensitive to blocks in the mitochondrial 1C metabolism pathway measured from hearts of ~1-year-old C10 G58R by untargeted metabolomics as in (B). Data is from the unnamed dataset that also appears in Dataset EV4 (for C10 G58R ~ 1 year). Statistical analysis for the metabolomics dataset is described in Methods. Significance indicated on graph, tested using two-sided Student’s t-tests, was corrected for multiple comparisons across all metabolites in the dataset, using the Benjamini–Hockberg procedure. Adjusted p-values (for metabolites left to right) for C10 WT vs. C10 G58R; CTRL ASO are 0.9709, 0.5572, 0.4919, 0.004337, and 0.6930. Adjusted p-values (for metabolites left to right) for C10 WT vs. C10 G58R; OMA1 ASO are 0.003006, 0.007981, 0.8724, 0.3951, and 0.8988. Error bars indicate the SD. ** indicates p ≤ 0.01 and “ns” not significant. N ≥ 6 mice per group (genotype). (E–G) Levels of amino acids measured from hearts of P56 Tfam mKO, ~1-year-old C10 G58R, or P28 C10 G58R mice as in (C). Data is from the unnamed dataset that also appears in Dataset EV4 (for C10 G58R ~ 1 year) and the named datasets in Dataset EV5 (for P28 C10 G58R and Tfam mKO). Statistical analysis for the metabolomics dataset is described in Methods. Significance indicated on graph, tested using two-sided Student’s t-tests, was corrected for multiple comparisons across all metabolites in the dataset, using the Benjamini–Hockberg procedure. In (E), adjusted p-values for CTRL vs. Tfam mKO; Dele1 KO comparison (for metabolites listed left to right) were 2.67E−05, 9.30E−06, 0.0001437, 0.001376, 0.001376, 0.0002088, 0.001959, 0.0002551, 0.007751, 0.005143, 0.01233, 0.03223, 0.08644, 0.001959, 0.5636, 0.0002551, 0.1087. In (E), adjusted p-values for Tfam mKO vs. Tfam mKO; Dele1 KO comparison (for metabolites listed left to right) were 0.003740, 0.0006115, 0.01132, 0.001234, 0.003740, 0.001615, 0.001740, 0.001615, 0.004377, 0.003740, 0.004263, 0.004849, 0.06566, 0.2845, 0.1847, 0.1052, 0.1515. In (F) adjusted p-values for CTRL vs. C10 G58R; CTRL ASO comparison (for metabolites listed left to right) were 0.0006519, 3.58E−06, 4.57E−05, 2.71E−06, 0.04601, 3.55E−05, 6.62E−05, 0.0005232, 3.16E−05, 0.007724, 0.01307, 0.5611, 0.06687, 0.2196, 0.001016, 0.04463. In (F), adjusted p-values for C10 G58R; CTRL ASO vs. C10 G58R; Oma1 ASO KO comparison (for metabolites listed left to right) were 0.004201, 0.0005487, 0.01111, 1.47E−05, 0.1337, 0.005503, 0.007491, 0.001017, 0.001807, 0.03986, 0.08713, 0.09570, 0.005235, 5.26E−05, 0.0009977, 0.009547. In (G), adjusted p-values for CTRL vs. C10 G58R Dele1 KO comparison (for metabolites listed left to right) were 0.1762, 0.06858, 0.1762, 0.06858, 0.2655, 0.2837, 0.2655, 0.2655, 0.1630, 0.1242, 0.1866, 0.1418, 0.7218, 0.6800, 0.2655, 0.1762, 0.8507. In (G), adjusted p-values for C10 G58R vs. C10 G58R; Dele1 KO comparison (for metabolites listed left to right) were 0.2684, 0.1241, 0.3593, 0.1500, 0.2196, 0.9517, 0.8701, 0.6962, 0.1512, 0.2196, 0.2196, 0.2196, 0.2196, 0.7206, 0.008545, 0.3180, 0.1500. In all graphs, *, **, ***, **** indicates p ≤ 0.05, 0.01, 0.001, 0.0001, respectively, and “ns” not significant. N ≥ 6 mice per group (genotype). Error bars represent SD. Source data are available online for this figure.

