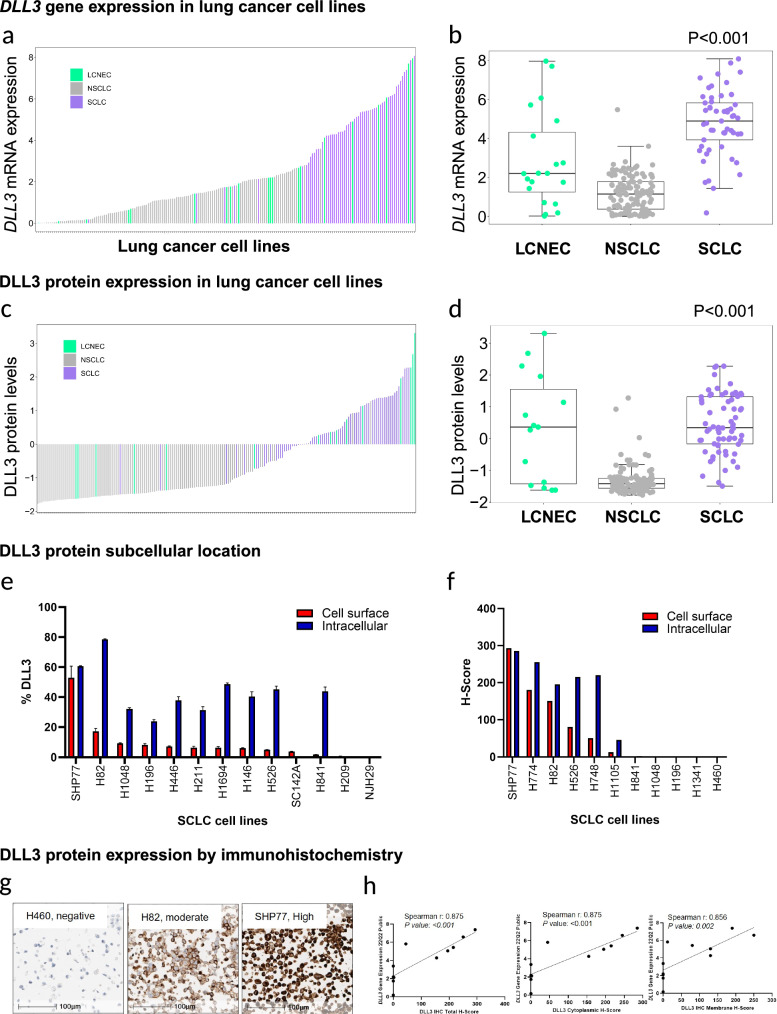
Fig. 1. Gene and protein expression patterns of DLL3 in lung cancer cell lines.
Plots illustrating DLL3 gene (a) and protein (c) expression patterns of small cell lung carcinoma (SCLC), large cell neuroendocrine carcinoma (LCNEC), non-small cell lung carcinoma (NSCLC) and showing higher levels of DLL3 gene (b) and protein (d) expression in SCLC and LCNEC cell lines compared to NSCLC. Illustrate higher levels of intracellular/cytoplasmic DLL3 compared to cell surface/membrane location, evaluated by flow cytometry (e) and immunohistochemistry (f). Lung cancer cell lines with known DLL3 expression by IHC. g, h Microphotographs showing different levels of DLL3 IHC expression (negative in H460, moderate in H82 and high in SHP77) (g). Correlation graphs and Total-Scores, Membrane H-Score, and Cytoplasmic S-core. Panels contains Spearman’s correlation coefficient and P values (h).

