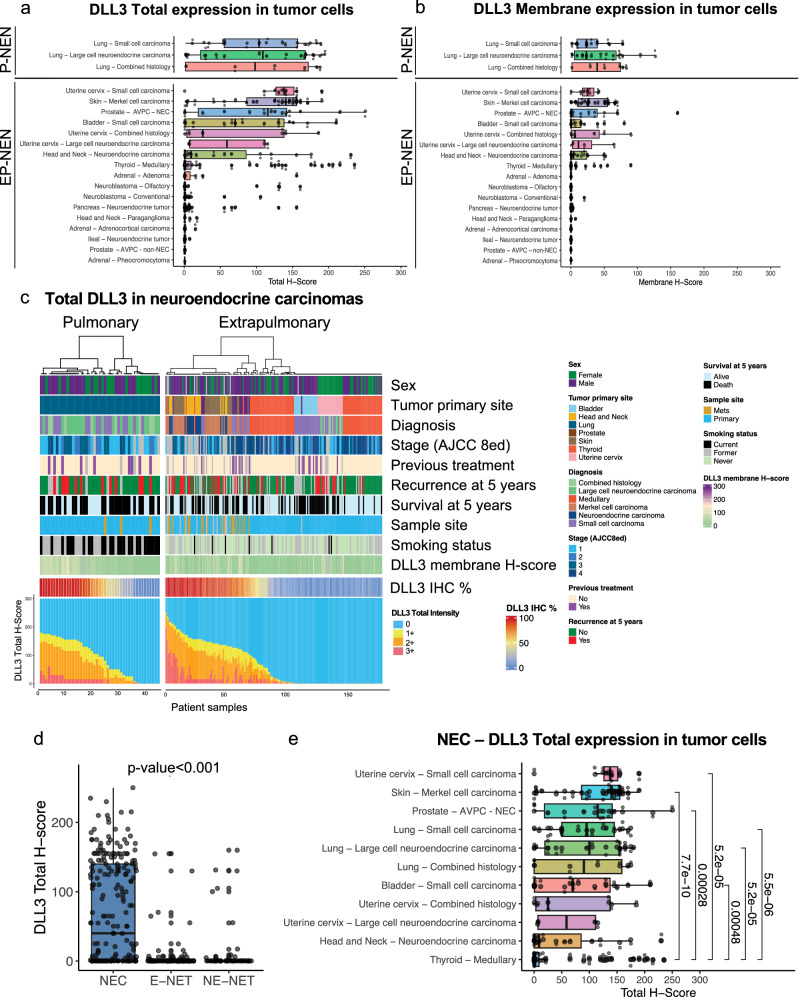
Fig. 2. Plots showing the levels of DLL3 expression in neuroendocrine neoplasms.
Plots illustrating DLL3 total (a) and membrane (b) H-scores in all samples included in this study. Pulmonary neuroendocrine neoplasms (P-NEN) and Extrapulmonary neuroendocrine neoplasms (EP-NEN) (a, b). c Graph illustrating the levels of Total DLL3 in neuroendocrine carcinomas (Pulmonary and Extra pulmonary) by intensity (0, 1 + ,2 + ,3 + ) of each sample, DLL3 total percentage and P values. d Box plots displaying differences of Total DLL3 H-score between neuroendocrine carcinomas (NEC), epithelial neuroendocrine tumors (E-NET) and non-epithelial neuroendocrine tumors (NE-NET). e Box blots showing differences in Total DLL3 H-score between medullary thyroid carcinoma and other neuroendocrine carcinomas in this study.

