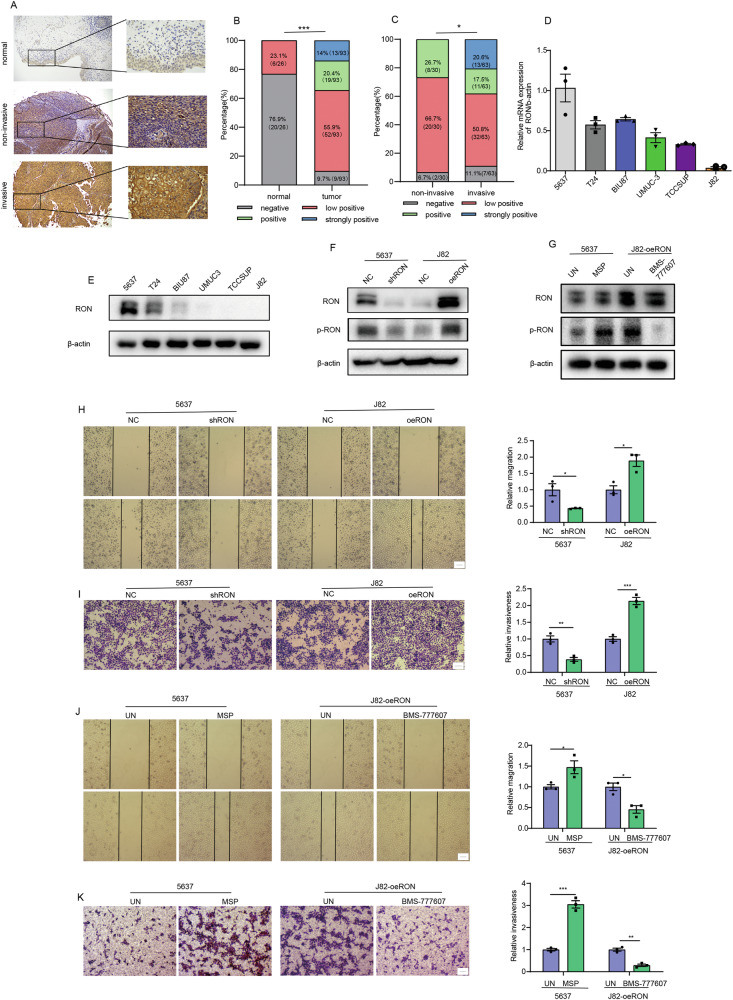
Fig. 1. Anomalous RON expression correlates with heightened migration and matrix invasion of bladder cancer cells.
A Immunohistochemical staining was performed to assess RON protein expression in bladder cancer (n = 93) and adjacent normal tissues (n = 26). B The IHC analysis revealed distinct staining patterns of RON protein expression in bladder cancer and adjacent normal tissues, with a total of 119 samples analyzed, including 26 normal tissues and 93 bladder cancer tissues. C The IHC analysis demonstrated varying staining patterns of RON protein expression in invasive and non-invasive bladder cancer tissues, with a total of 93 samples analyzed, including 30 non-invasive and 63 invasive bladder cancer tissues. D The relative mRNA expression level of RON in bladder cancer cell lines was assessed using quantitative real-time polymerase chain reaction (qRT-PCR, with 5637 cells serving as the control). E The protein expression level of RON in bladder cancer cell lines was determined through western blot analysis. F A total of 5637 cells were subjected to transfection with either the shRON Lentiviral vector or the corresponding empty lentiviral vector to generate stable cell lines with low RON expression levels (designated as 5637-NC and 5637-shRON, respectively). Similarly, J82 cells were transfected with the RON Lentiviral vector or the corresponding empty lentiviral vector to establish stable cell lines with overexpressed RON (designated as J82-NC and J82-oeRON, respectively). The expression of RON and p-RON were subsequently validated using Western blot analysis. H The migratory capacity of 5637-NC, 5637-shRON, J82-NC, and J82-oeRON cells was assessed using a wound healing assay. Representative images were obtained at a magnification of 40× (Scale bar 1 µm). I The invasion ability of 5637-NC, 5637-shRON, T24-NC, and T24-oeRON cells was evaluated by trans-well assay. Representative images were captured at a magnification of 40× (Scale bar 1 µm). In total, 5637 cells were stimulated with MSP for 24 h, and J82-oeRON cells were treated with RON inhibitor BMS-777607 for 24 h. G Western blot analysis was performed to assess the phosphorylation status of RON. J Cell migration was assessed using a wound-healing assay. Representative images were obtained at a magnification of 40× (Scale bar 1 µm). K The invasion ability of the cells was evaluated by trans-well assay. Representative images were captured at a magnification of 40× (Scale bar 1 µm). Experiments in D–K were repeated three times (n = 3).

