
Figure 3.
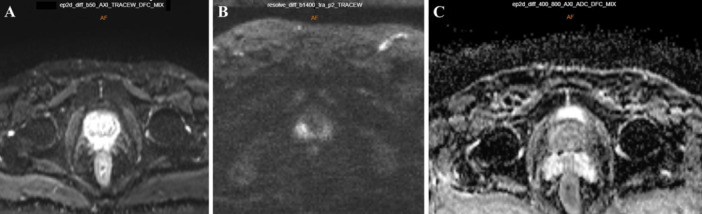
DWI acquired at b‐value 50 s/mm2 (A), b‐value 1400 s/mm2 (B) with ADC map (C). High b‐values result in the suppression of the background normal prostate signal, enabling the visualization of cancerous lesions as bright areas.
Official websites use .gov
A
.gov website belongs to an official
government organization in the United States.
Secure .gov websites use HTTPS
A lock (
) or https:// means you've safely
connected to the .gov website. Share sensitive
information only on official, secure websites.
DWI acquired at b‐value 50 s/mm2 (A), b‐value 1400 s/mm2 (B) with ADC map (C). High b‐values result in the suppression of the background normal prostate signal, enabling the visualization of cancerous lesions as bright areas.