. 2024 Nov 17;12(11):e009522. doi: 10.1136/jitc-2024-009522

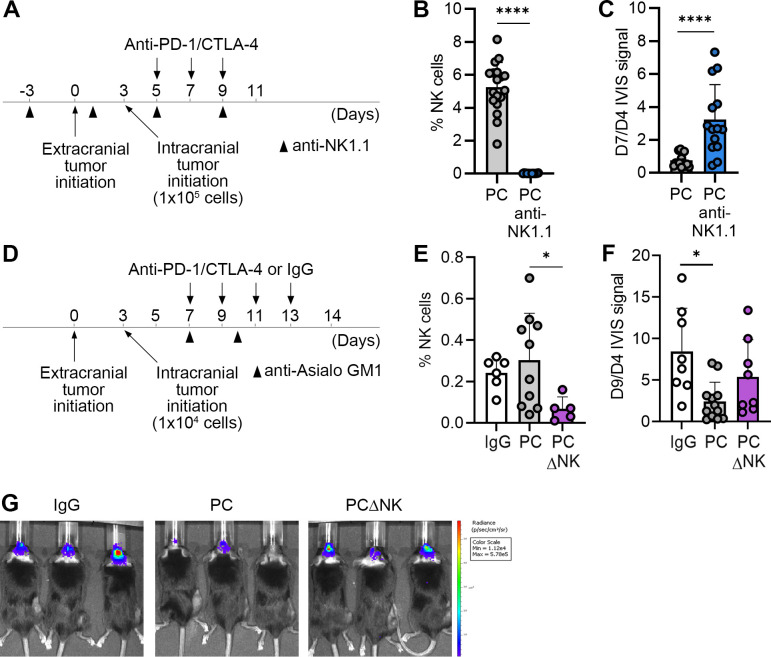
Figure 1. Depletion of NK cells results in a loss of intracranial ICB efficacy. (A) Experimental scheme for experiments shown in B and C. The timeline for implantation of B16-OVA (s.c.) and B16-OVA/Fluc (intracranial) cancer cells in the two-site BrM model, therapeutic schedule, and schedule for administration of anti-NK1.1 antibodies for depletion of NK cells are indicated. (B) Quantification of NK cells within intracranial tumors by flow cytometry (n=16/18 for PC and PC anti-NK1.1, respectively). Combined data from two independent experiments are shown. NK depletion in the PC anti-NK1.1 group (blue) was performed throughout the experiment, as indicated in A. (C) Quantification of intracranial B16-OVA/Fluc tumor burden via bioluminescence imaging (n=14/14 for PC and PC anti-NK1.1, respectively). Data from two independent experiments were combined. Fold change in bioluminescence signal intensity between days 7 and 4 post-intracranial cancer cell implantation, corresponding to days 10 and 7 of the experimental timeline (eg, pretreatment/post-treatment with PC) is shown. NK depletion in the PC anti-NK1.1 group (blue) was performed throughout the experiment, as indicated in A. (D) Experimental timeline for experiments shown in E–G, including schedule for administration of anti-Asialo-GM-1 antibodies for depletion of NK cells post-first therapeutic dose. (E) Quantification of NK cells within intracranial tumors by flow cytometry (n=6/10/5 for IgG, PC and PCΔNK, respectively). NK depletion in the PCΔNK group (purple) was performed after the first treatment dose, as indicated in D. (F) Quantification of intracranial B16-OVA/Fluc tumor burden via bioluminescence imaging (n=8/12/8 for IgG, PC and PCΔNK, respectively). Fold change in bioluminescence signal intensity between days 9 and 4, corresponding to days 12 and 7 of the experimental timeline (eg, pretreatment/post-treatment with PC) is shown. NK depletion in the PCΔNK group (purple) was performed after the first treatment dose, as indicated in D. (G) Representative bioluminescence images of mice from experiment following the timeline shown in D. Statistical differences were determined by Mann-Whitney test (B and C), one-way ANOVA (E) and unpaired Kruskal-Wallis test with pairwise comparison of mean values (F); *p≤0.05, **p≤0.01, ***p≤0.001, ****p≤0.0001. ANOVA, analysis of variance; BrM, brain metastases; CTLA-4, cytotoxic T-lymphocyte-associated protein 4; Fluc, Firefly luciferase; ICB, immune checkpoint blockade; IgG, immunoglobulin G; NK, natural killer; PC, PD-1/CTLA-4; PD-1, programmed death-1; s.c., subcutaneous.

Figure 1