. 2024 Nov 17;12(11):e009522. doi: 10.1136/jitc-2024-009522

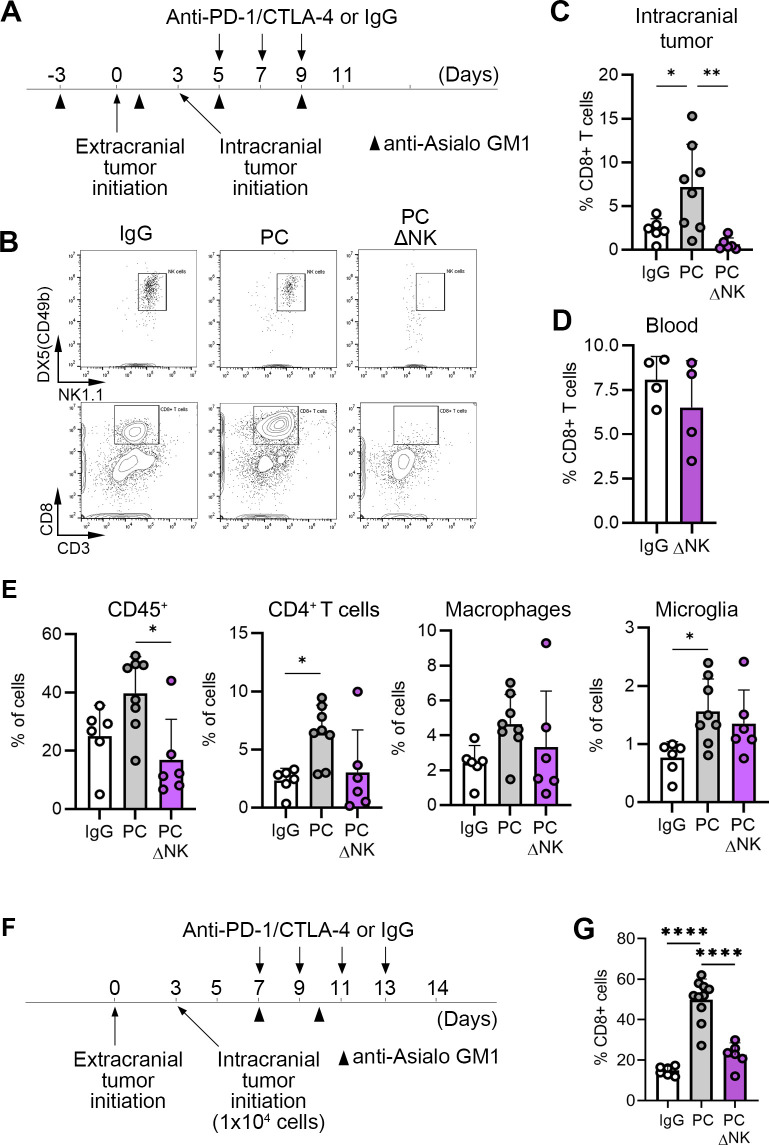
Figure 4. NK cells regulate the abundance of CD8+T cells in intracranial tumors. (A) Experimental timeline and schedule for administration of anti-Asialo-GM-1 antibodies for experiments shown in B–E. (B) Representative flow cytometry plots of NK cells and CD8+T cells in intracranial tumors at the endpoint. (C) Quantification of CD8+T cells in intracranial tumors (n=6/8/6 for IgG, PC and PCΔNK, respectively). One out of two representative experiments is shown. (D) Quantification of CD8+T cells in peripheral blood (n=4). (E) Quantification of CD45+cells, CD4+T cells, macrophages (CD11b+F4/80+CD45high) and microglia (CD11b+F4/80+CD45low) in intracranial tumors (n=6/8/6 for IgG, PC and PCΔNK, respectively). One out of two representative experiments is shown. (F) Experimental timeline and schedule for administration of anti-Asialo-GM-1 antibodies for experiment shown in G. (G) Quantification of CD8+T cells in intracranial tumors (n=6/10/6). Statistical significance in D was determined by unpaired two-tailed t-test. Significant differences in C, E and G were determined by one-way ANOVA, with exception of percentages of CD45+cells in E, where unpaired Kruskal-Wallis test with pairwise comparison of mean values was used; *p≤0.05, **p≤0.01, ***p≤0.001, ****p≤0.0001. ANOVA, analysis of variance; CTLA-4, cytotoxic T-lymphocyte-associated protein 4; IgG, immunoglobulin G; NK, natural killer; PC, PD-1/CTLA-4; PD-1, programmed death-1.

Figure 4