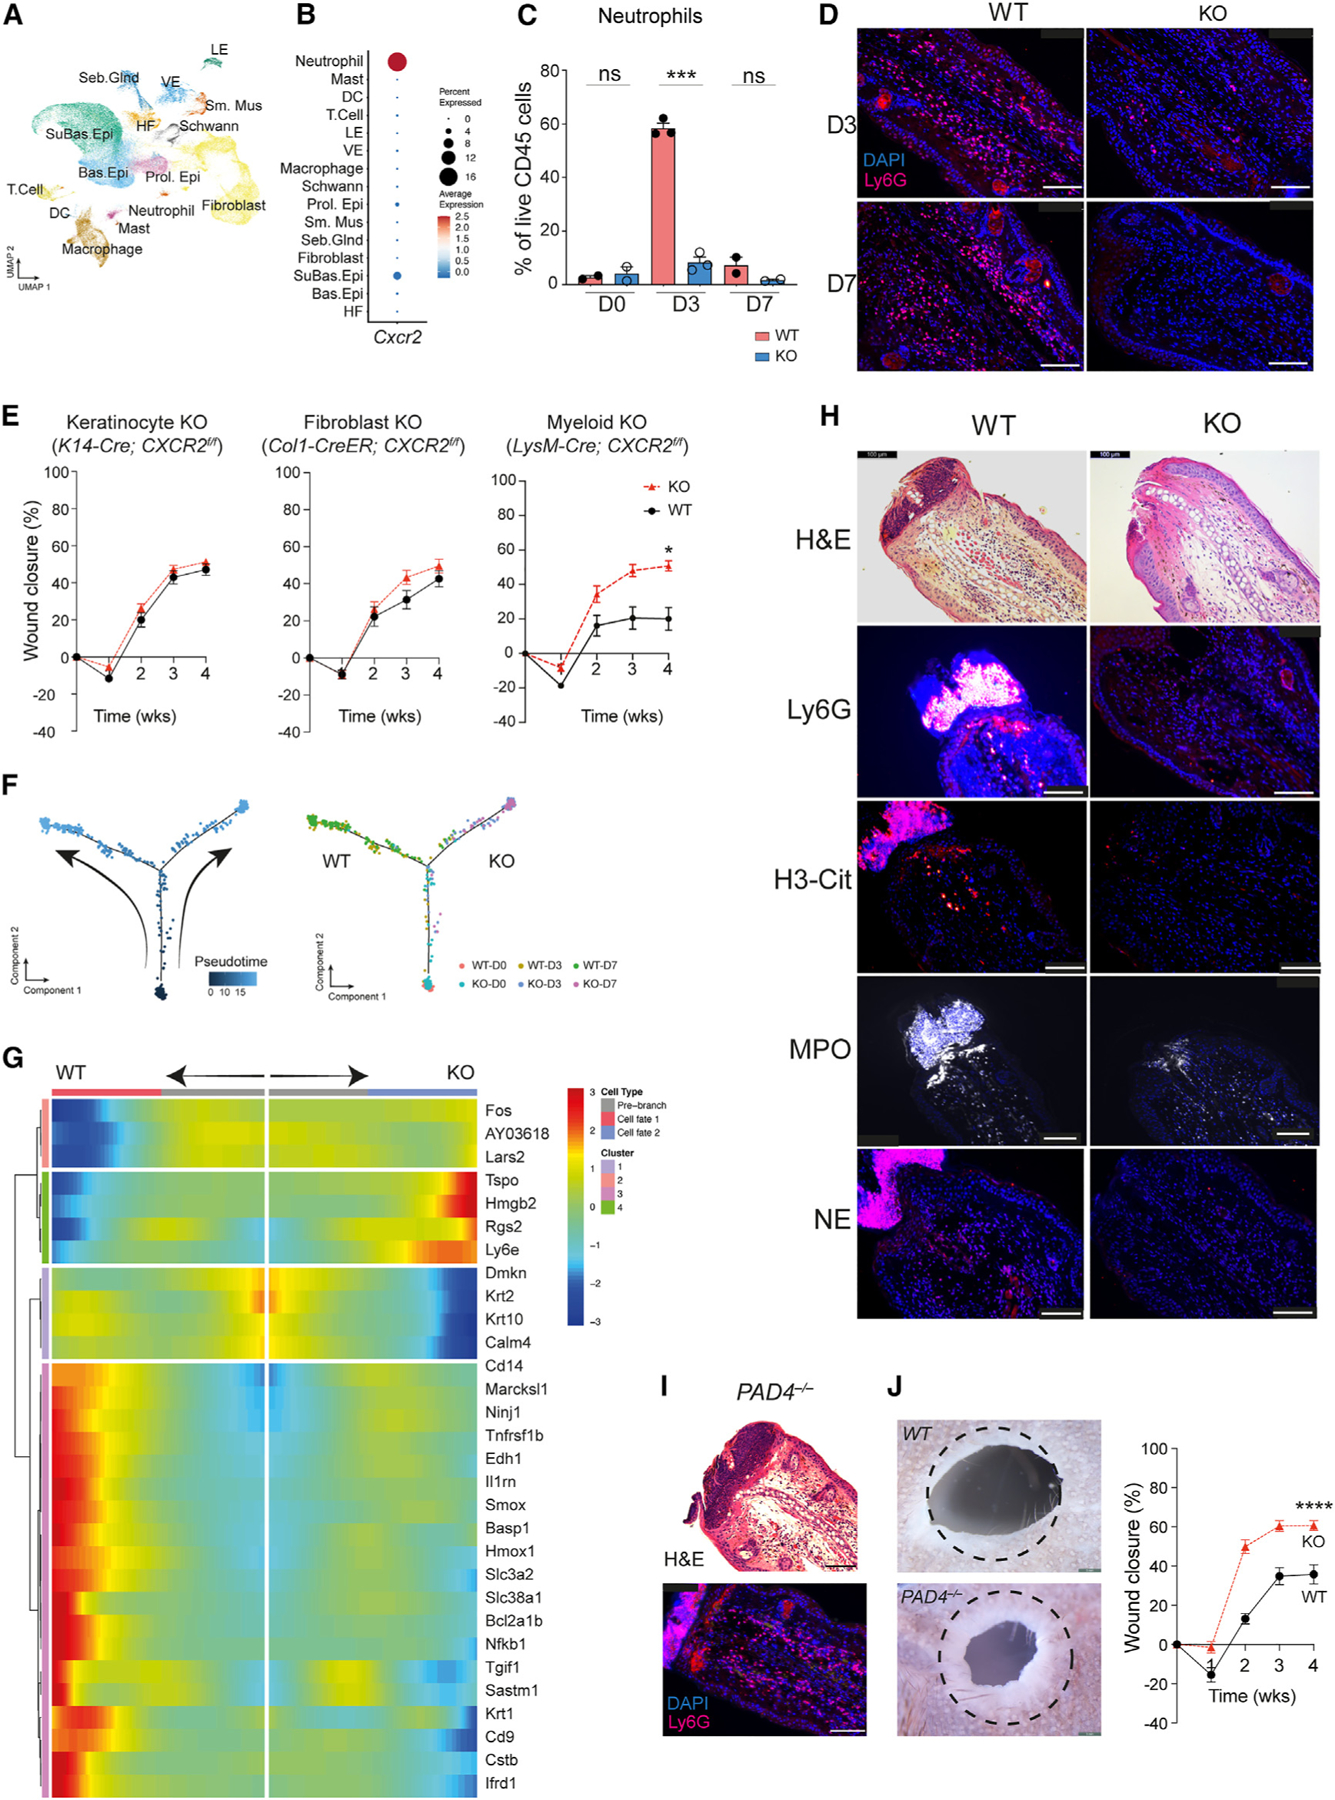
Figure 3. Cell-type-specific CXCR2 KO mice exhibit partial tissue regeneration.

(A) Uniform manifold approximation and projection depicting cell clusters from WT (n= 2) and CXCR2 KO (n = 3) in wound-edge skin from the ear hole closure model on days 0, 3, and 7 after injury.
(B) Dot plot demonstrating levels and percentages of cells expressing Cxcr2.
(C) Quantification of neutrophils in WT and CXCR2 KO wounded skin by flow cytometry. n=2 for day 0 and day 7 groups; n=3 for day 3 groups. Unpaired two-tailed Student’s t test.
(D) Representative image of immunofluorescence for neutrophils (Ly6G+) in WT and CXCR2 KO wound-edge skin at day 3. Scale bars, 100 μM.
(E) Ear hole closure in control and cell-specific CXCR2 KO mice: keratinocyte (K14-Cre; CXCR2f/f, n = 16 and 20 for control and KO, respectively), fibroblasts (Col1-Cre-ER; CXCR2f/f, n = 8 for each group), myeloid cells (neutrophils and macrophages, LysM-Cre; CXCR2f/f, n = 7 for each group). 2-way ANOVA.
(F) Pseudotime trajectory analysis of neutrophils from WT and CXCR2 KO mice. Each dot represents a cell. Left: kinetics. Right: sample origin.
(G) Differentially expressed genes identified in pseudotime branched expression analysis modeling analysis.
(H) Representative images of immunofluorescence detecting neutrophils (Ly6G) and NETs (citrullinated-H3 [H3-Cit], myeloperoxidase [MPO], and neutrophil elastase [NE]) in WT and CXCR2 KO mice. n = 5. Scale bars, 100 μM.
(I) Representative image of immunofluorescence detecting neutrophils (Ly6G) in PADI4 KO mice. n = 3. Scale bars, 100 μM.
(J) Representative photographs and percentages of ear hole closure in control and PADI4 KO mice. n = 10 for each group. A dotted circle represents the original 2-mm hole. 2-way ANOVA. *p < 0.05, **p < 0.01, ***p < 0.001, ****p < 0.0001. Mean ± SEM are plotted.
