
Figure 4. G-CSF is necessary and sufficient to reduce scarring and to promote scarless tissue regeneration.
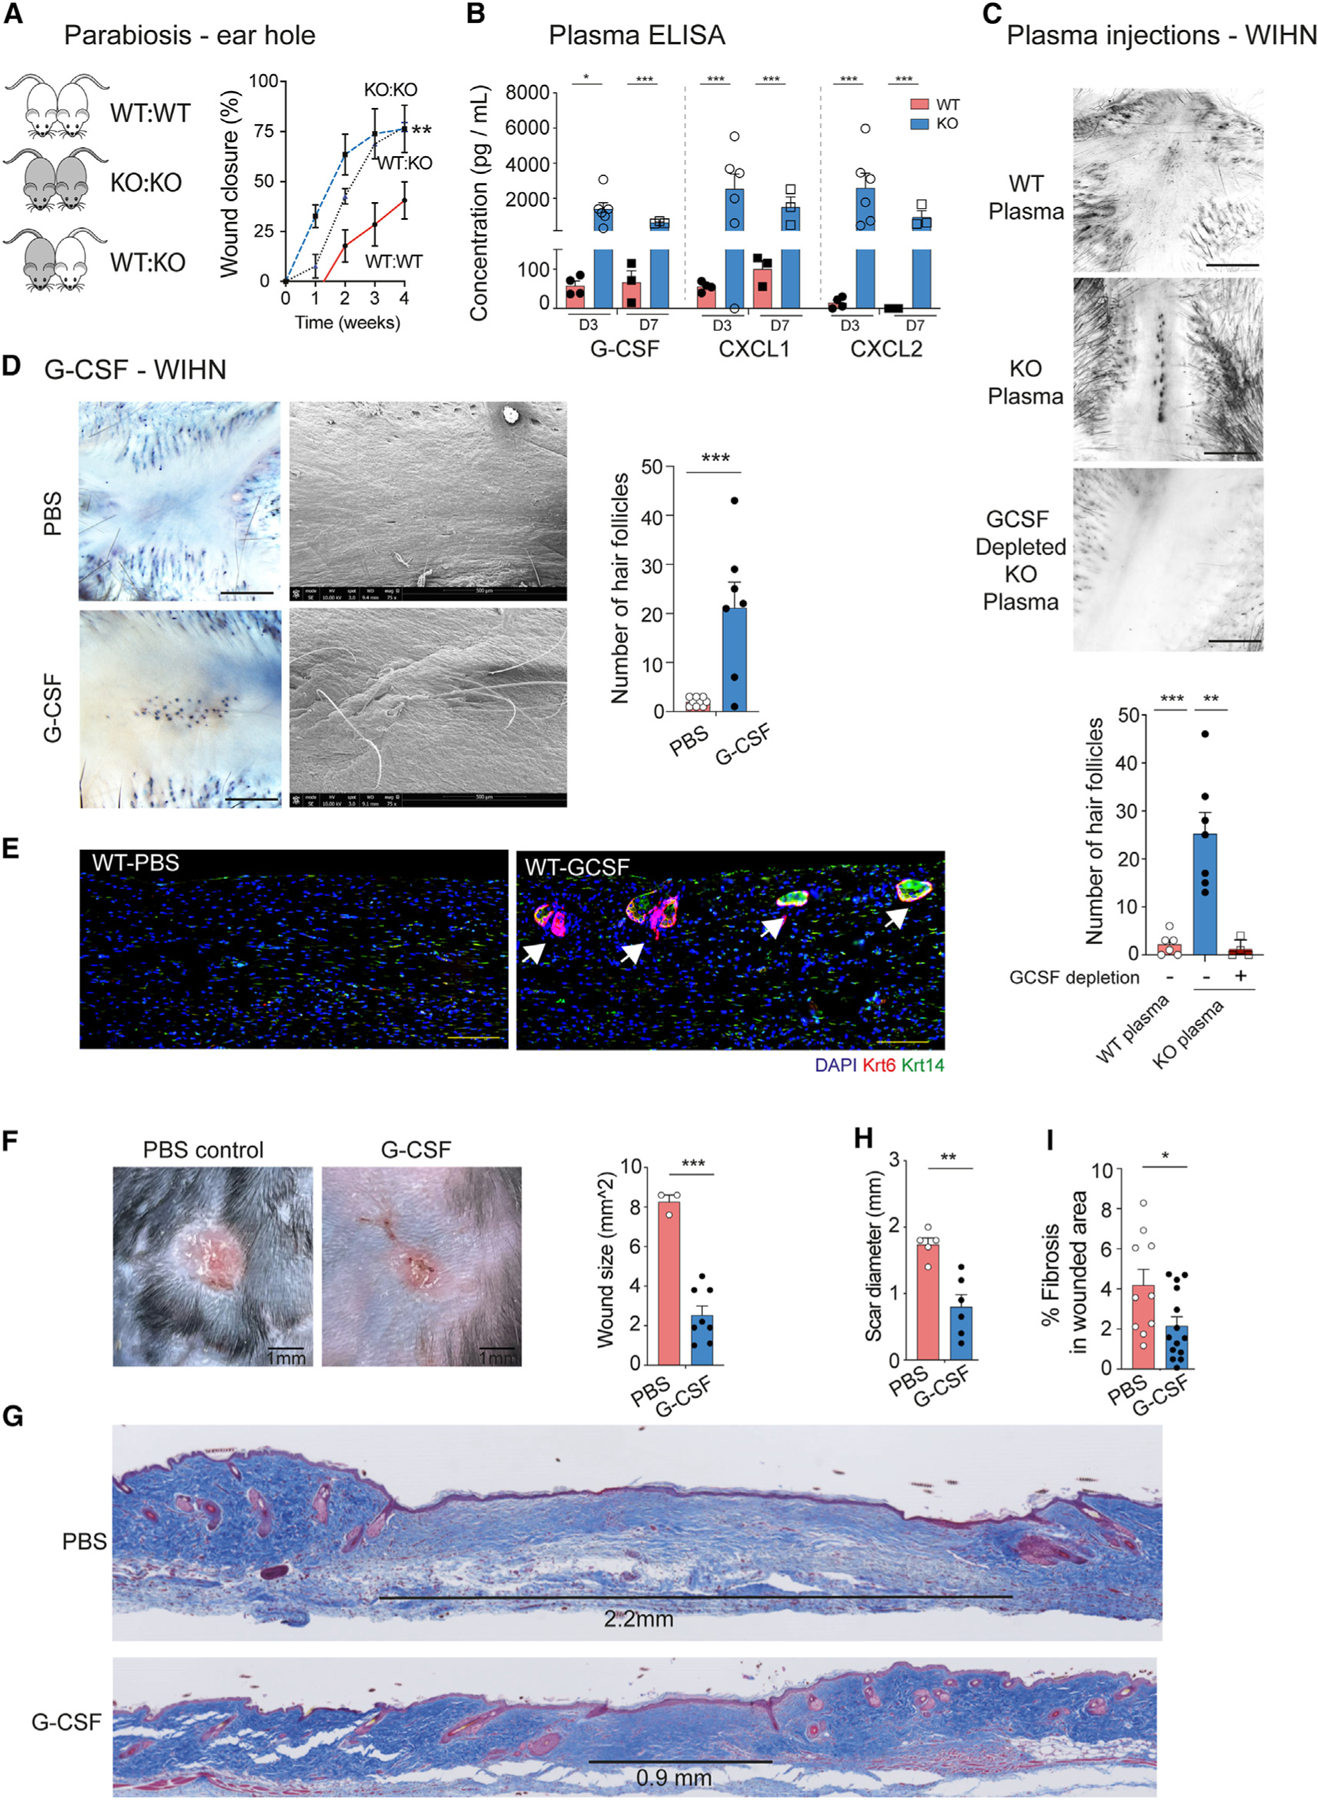
(A) Parabiosis between WT:WT (n = 4, red solid line), CXCR2 KO:CXCR2 KO (n = 3, blue dotted line), and WT:CXCR2 KO mice (n = 4, black dotted line). Shown is the percentage of ear hole closure. 2-way ANOVA comparing WT:KO pairs to WT:WT pairs.
(B) ELISA measuring cytokine expression in injured WT (n = 4 for day 3, n = 3 for day 7) and CXCR2 KO (n = 6 for day 3, n = 3 for day 7) plasma. Unpaired two-tailed Student’s t test.
(C) WT (n = 6), CXCR2 KO (n = 7) and G-CSF depleted CXCR2 KO (n = 4) plasma was injected daily into the wound bed of WT mice undergoing WIHN for the first 3 days after injury. Shown are representative photographs and quantification of hair follicles. Scale bars, 100 μM. Unpaired two-tailed Student’s t test.
(D) G-CSF (n = 9) or PBS (control, n = 7) was injected daily into the wound bed of WT mice undergoing WIHN for the first 3 days after injury. Representative photographs of whole-mount and scanning electron microscopy demonstrating unpigmented hairs in the center of the healed areas. Right: quantification of hair follicles. Scale bars, 100 μM. Unpaired two-tailed Student’s t test.
(E) Representative immunofluorescence images of PBS and G-CSF-injected WT wound beds depicting hair follicle structures (Krt14+, Krt6+) Scale bars, 100 μM.
(F) Representative photographs and quantification of scar size of G-CSF-treated (n = 8) or PBS-treated (control, n = 3) stented back wounds at day 28 after injury. Scale bars, 1 mm. Unpaired two-tailed Student’s t test.
(G) Representative trichrome-stained tissue sections from G-CSF- or PBS-treated stented back wounds. A black line highlights scar size.
(H) Quantification of scar diameter for G-CSF (n = 6) or PBS-treated (n = 3) mice. Unpaired two-tailed Student’s t test.
(I) Wound fibrosis assessed by picrosirius red staining in G-CSF-treated (n = 14 sections) or PBS-treated (n = 10 sections). Unpaired two-tailed Student’s t test. *p < 0.05, **p < 0.01, ***p < 0.001, ****p < 0.0001. Mean ± SEM are plotted.