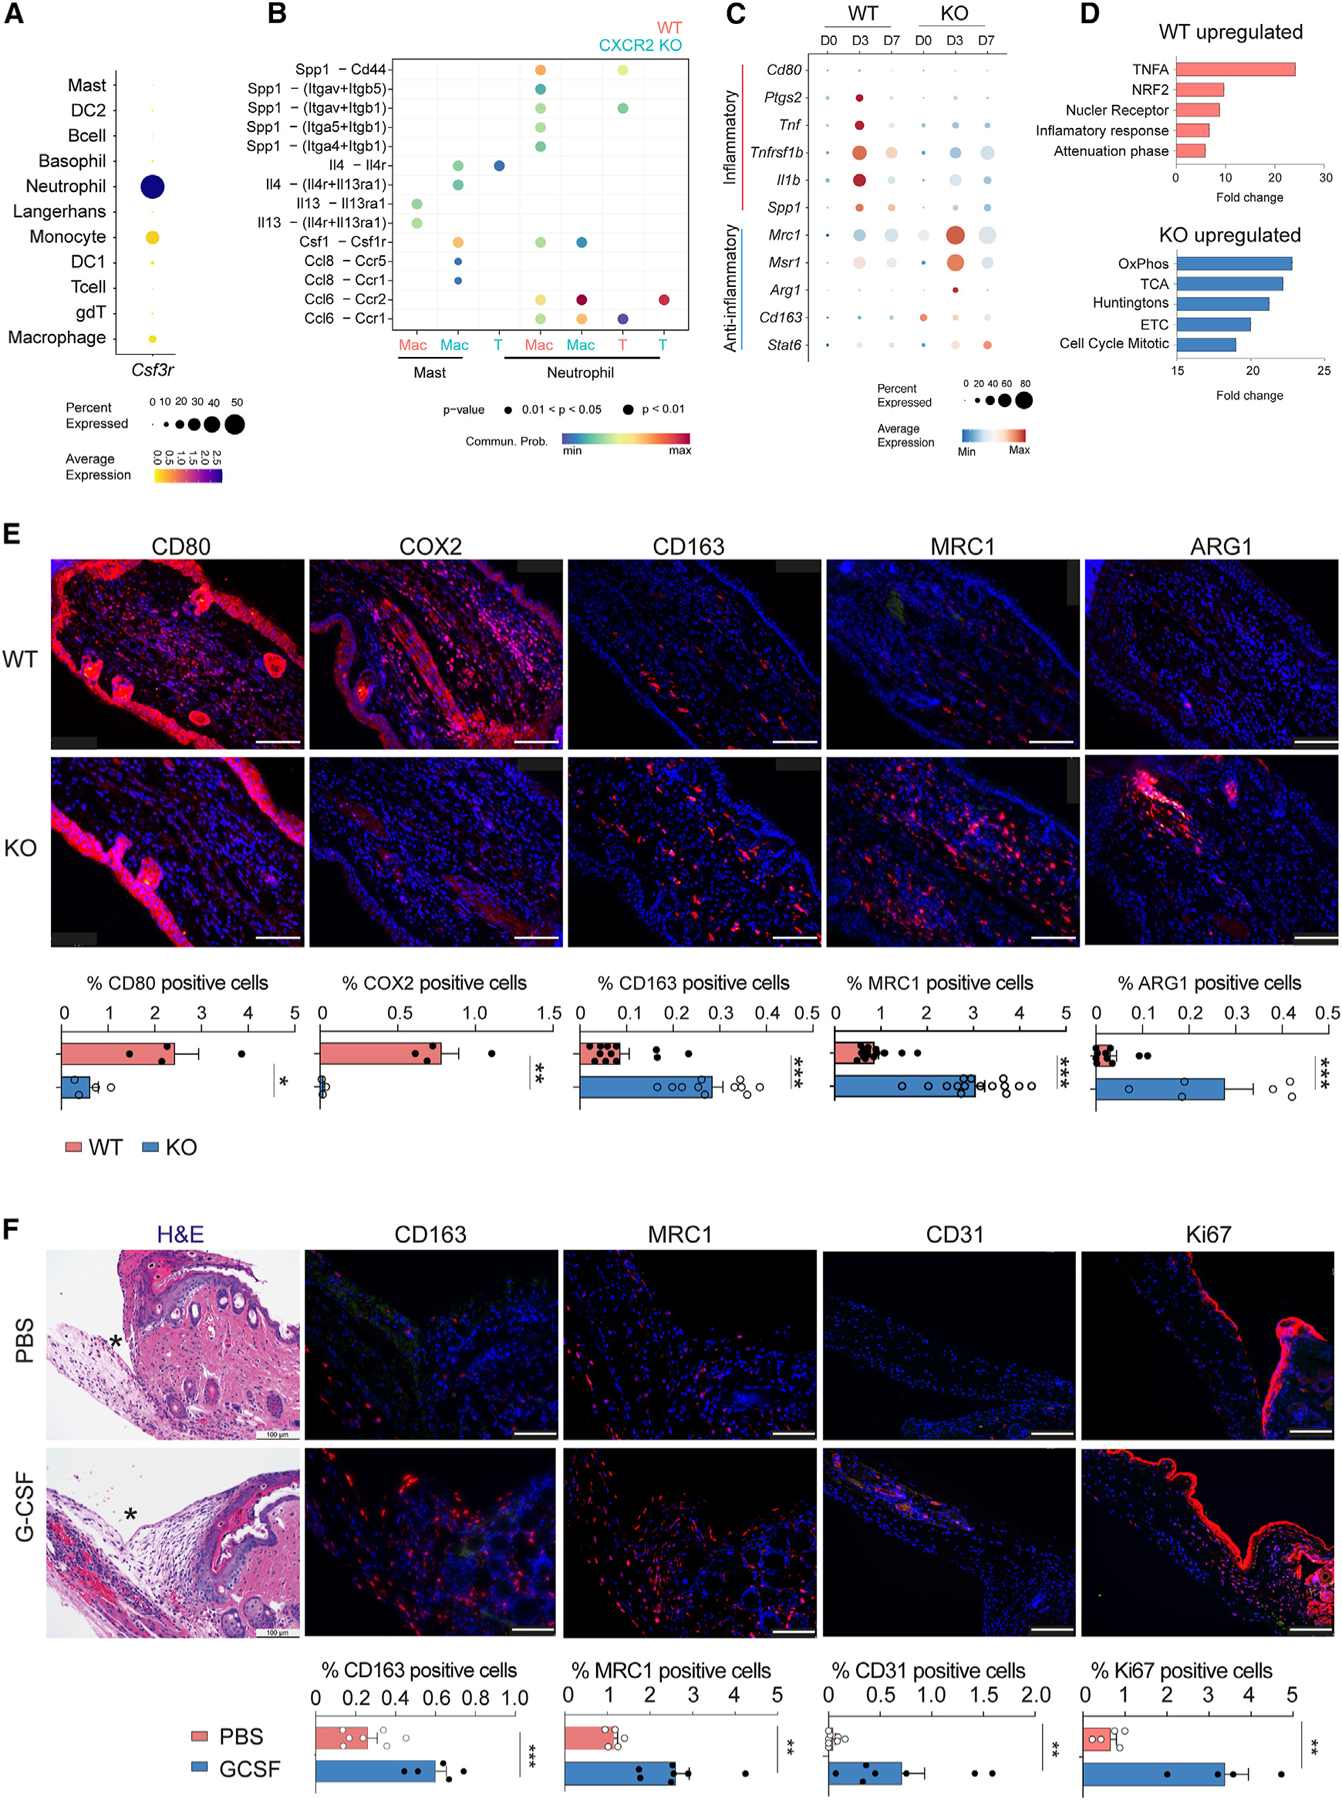
Figure 5. G-CSF polarizes macrophages to an anti-inflammatory phenotype to promote tissue regeneration.

(A) Dot plot demonstrating average expression and percentage of immune cells expressing Csf3r.
(B) Analysis of key cell-to-cell interactions between immune cells in the ear skin of WT (salmon color) and CXCR2 KO (blue color) mice. Mac, macrophage; T, T cell.
(C) Dot plot demonstrating average gene expression of key genes between WT and CXCR2 KO macrophages.
(D) GSEA of macrophage populations in WT and CXCR2 KO wounded skin.
(E) Representative images and quantification of immunofluorescence of WT and CXCR2 KO wounded skin for CD80 (n = 4), COX2 (n = 4), CD163 (n = 12 for WT and n = 11 for KO), MRC1 (n = 10 for WT and n = 6 for KO), and ARG1 (n = 10 for WT and n = 6 for KO). Cell percentages are calculated with total DAPI+ cells as the denominator. Scale bars, 100 μM. Unpaired two-tailed Student’s t test.
(F) Representative H&E immunostaining images and quantification of PBS- and G-CSF-injected stented back wounds of WT mice for CD163 (n = 7 for PBS and n = 5 for G-CSF), MRC1 (n = 5 for PBS and n = 7 for G-CSF), CD31 (n = 8 for PBS and n = 7 for G-CSF) and Ki67 (n = 5 for PBS and n = 4 for G-CSF). Cell percentages are calculated with total DAPI+ cells as the denominator. Scale bars, 100 μM. Unpaired two-tailed Student’s t test. *p < 0.05, **p < 0.01, ***p < 0.01. Mean ± SEM are plotted.
