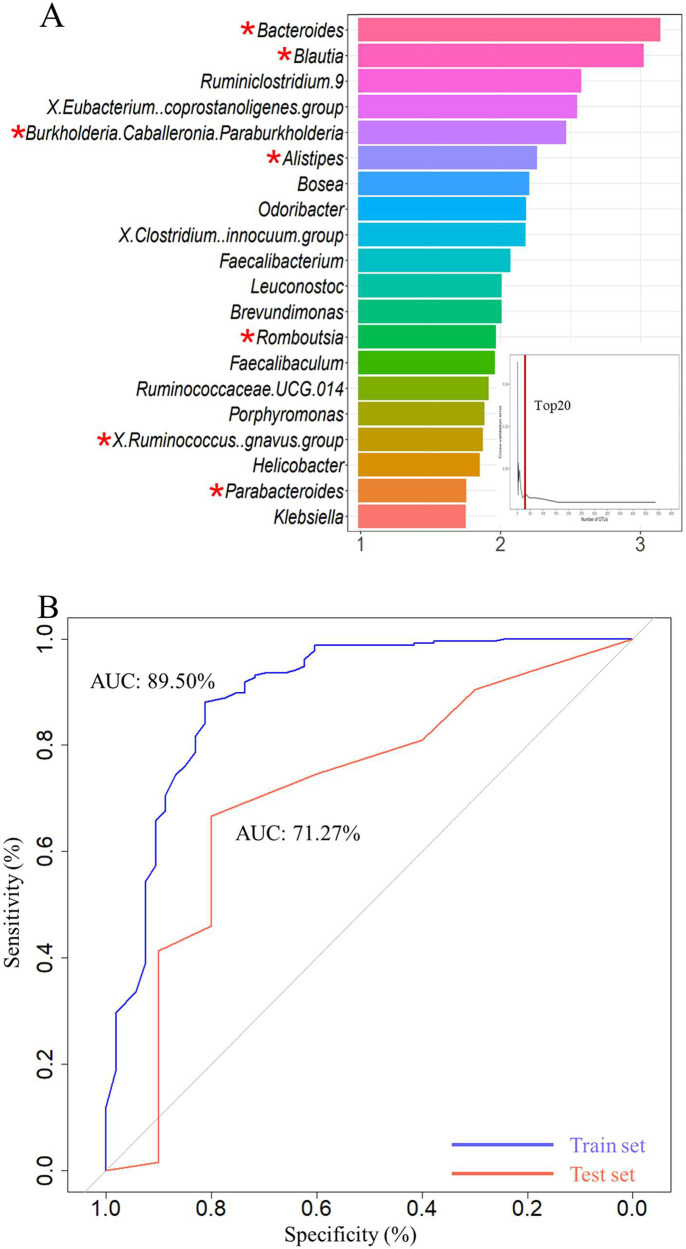
Figure 4.
Classifiers derived from GM, verifying specific OTU markers, to predict the occurrence of SDD. (A) In the training phase, a 10-fold cross-validation was conducted on the random forest model, and the estimated top 20 differentially abundant markers were chosen as the optimal marker set according to the random forest model between 53 SDD and 235 non-SDD. (B) The AUC value between SDDs and non-SDD in the train and test set. The x-axis reflected the mean decrease accuracy to each microbial taxa, which presents the contribution to the accuracy of the model. “*” indicates the relative abundance difference originating from LEFSe analysis of 16s rRNA gene sequencing at the genus level in SDD-T versus non-SDD.

