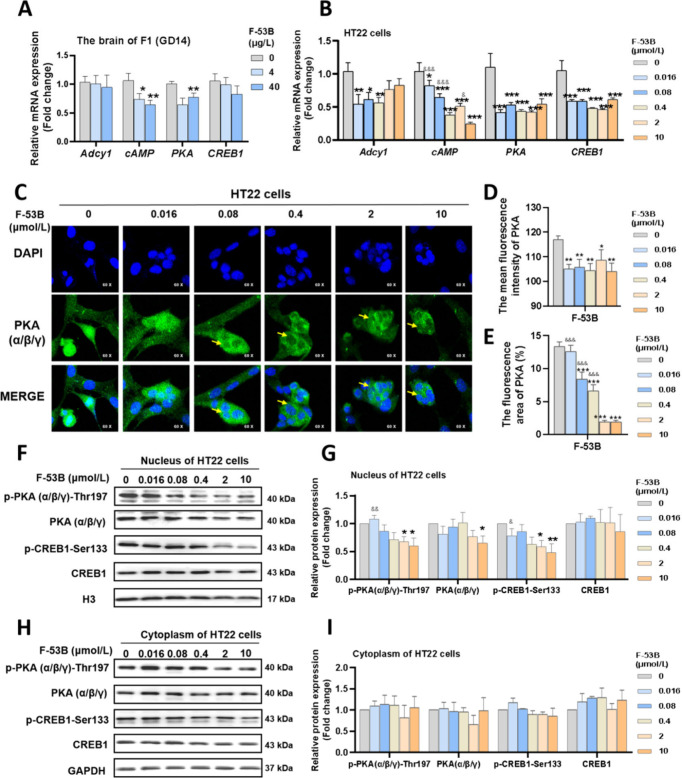
Figure 4.
Effects of F-53B exposure on the PKA/CREB pathways in fetal mice and HT22 neurons. (A-B) The relative mRNA levels of the PKA/CREB pathways related genes in the fetal brain and HT22 neurons. (C-E) Representative photomicrographs of PKA levels and location in HT22 neurons. (F-I) The blots and diagrams of the PKA/CREB pathways related protein in the nucleus and cytoplasm of HT22 neurons. Comparison with the control group is indicated by the symbol “*”. Comparison with the 10 μmol/L F-53B-exposed group is indicated by the symbol “&”. * and & indicate p < 0.05, ** and && indicate p < 0.01, *** and &&& indicate p < 0.001.

