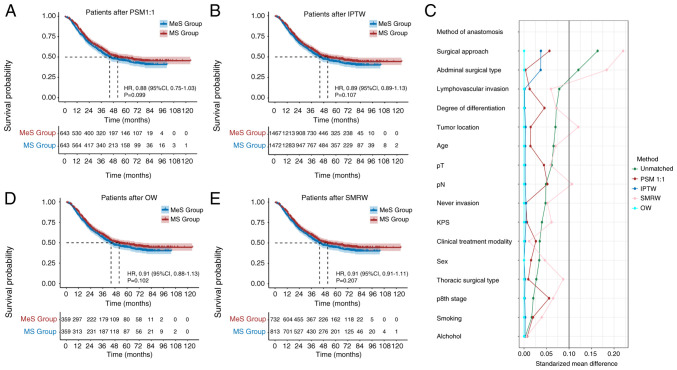
Figure 3.
OS curves of participants. (A) OS curve of MeS and MS groups after PSM; (B) OS curve of MeS and MS groups after IPTW. (C) Standardized mean difference among the subjects stratified by characteristic. (D) OS curve of MeS and MS groups after OW; (E) OS curve of MeS and MS groups after SMRW. OS, overall survival; MS, manual suturing; MeS, mechanical suturing; HR, hazard ratio; PSM, performing propensity score matching; IPTW, inverse probability of treatment weighting; OW, overlap weighting; SMRQ, standardized mortality ratio weighting; KPS, Karnofsky performance status.

