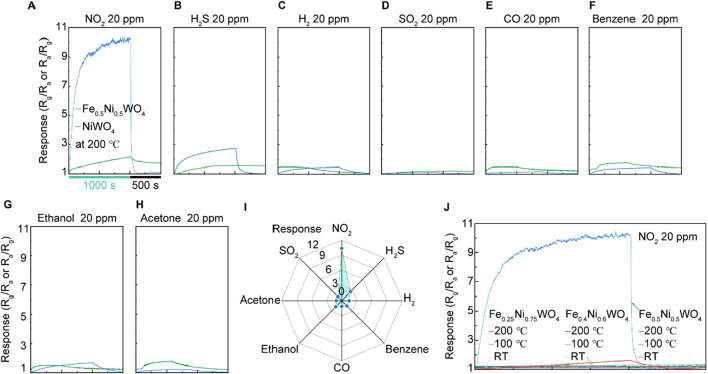
FIGURE 4.
Gas-sensing results of NiWO4 and Fe0.5Ni0.5WO4 at 200°C under 20 ppm of different gases. (A) NO2 at RT, 100°C, and 200°C, respectively. (B) H2S at RT, 100°C, and 200°C. (C) H2. (D) SO2. (E) CO. (F) Benzene. (G) Ethanol. (H) Acetone. (I) Results of gas selectivity. (J) Comparison of the responses under an NO2 environment and different temperatures using Fe0.25Ni0.75WO4 and Fe0.4Ni0.6WO4.

